Article
Restrictions on procurement of foodstuff for state and municipal needs

Starting September 3rd, 2016 the Government Regulation of the RF “Concerning access restrictions to certain ranges of foodstuff from foreign countries for purposes of procurements for meeting state and municipal needs” as of August 22nd, 2016 №832 came into force.

The Regulation, prepared by the Ministry of Agriculture, is focused on protection of the Russian agricultural market and correspondingly on support of domestic goods producers. The operation of restrictions won’t refer to commercial procurement of shops, outlet chains and public catering enterprises. The goods from the Eurasian Economic Union (EEU) countries are exempt from the restrictions, if no less than two applications meeting the requirements while identifying the supplier in the course of public procurement were filed.

In the restrictive list there are such foodstuffs as meat and fish products, milk, cheese, butter, rice, sugar and salt.

In the explanatory note to the Regulation it is stated that the above mentioned goods are produced in Russia and the EEU countries in the quantities sufficient for satisfying the needs of the social sphere.

Significant changes have taken place in the Russian market of foodstuffs recently. The growth of the production in many branches of farming is observed. We have already devoted several publications to production of grain, livestock, fishery и др

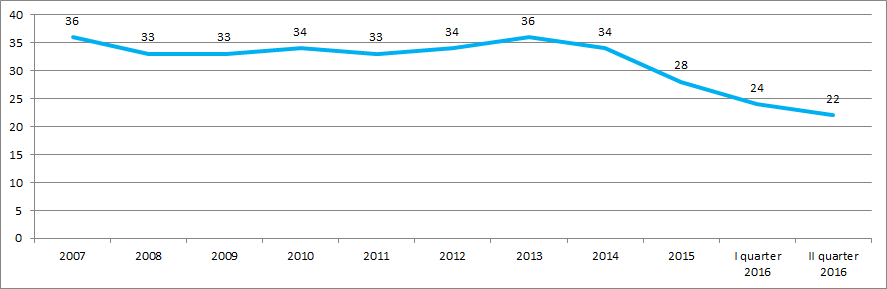
Moreover, there is a downtrend of dependence on imports on many types of foodstuff. The following data of the Federal State Statistics Service in the Figure 1 and Table 1 gives evidence to it.

Figure 1. Share of imported foodstuff in goods resources of foodstuff retail sale (%)
Share of imported foodstuff in goods resources of foodstuff retail sale (%)

Dependence on imports of cereals, pork, poultry, cheese, preserved meat and confectionery were decreasing with the biggest rates.

Table 1. Share of import of certain goods in their goods resources (per year, %)
Article201020112012201320142015Rates of decrease (increase) 2015 to 2010, %
Cereal 2,2 2,0 1,4 1,8 0,5 0,3 -86,3
Pork 46,8 42,8 41,3 31,0 16,6 12,5 -73,3
Poultry 18,2 12,5 14,0 12,8 10,2 5,6 -69,2
Cheese 47,4 46,1 47,8 48,0 37,3 23,3 -50,8
Preserved meat 17,1 22,0 25,1 20,0 13,7 9,0 -47,4
Confectionery 11,1 11,6 12,5 12,0 9,4 5,9 -46,8
Vegetable fat 23,9 22,0 16,3 19,0 14,7 17,5 -26,8
Beef 64,5 59,5 59,9 59,0 57,3 48,0 -25,6
Animal fat 32,3 32,2 34,2 35,9 34,4 25,5 -21,1
Flour 0,9 1,0 0,7 1,5 0,9 0,8 -11,1
Powder milk and cream 60,1 40,7 48,4 60,5 49,5 56,4 -6,2
Sugar 5,4 3,7 5,3 8,2 7,4 6,2 14,8
Ranking
Product profitability of vegetable production enterprises

Information agency Credinform presents a ranking of the largest Russian vegetable production enterprises in terms of product profitability ratio.

The companies with the highest volume of revenue (TOP-10) were selected for this ranking according to the data from the Statistical Register for the latest available period (2015). These enterprises were ranked by decrease in product profitability ratio. (Table 1).

Product profitability is calculated as the ratio of sales profit to expenses from ordinary activities. In general, profitability reflects the economic efficiency of production. Product profitability analysis allows us to make a conclusion whether output of one or another product is reasonable. There are no prescribed values for indicators of this group, because they vary strongly depending on the industry.

For the most full and fair opinion about the company’s financial position, not only product profitability rate should be taken into account, but also the whole set of financial indicators and ratios.

Table 1. Net profit, revenue, product profitability and solvency index of vegetable production enterprises (TOP-10)
Name, INN, regionNet profit 2015, mln RUBRevenue of 2015, mln RUBRevenue of 2015 to 2014, %%Product profitability of 2014, %Product profitability of 2015, %Solvency index Globas-i
JSC AGRICULTURAL COMPLEX TEPLICHNY
ИНН 2312036895 Krasnodar territory
502,4 1 140,0 119 62,09 80,19 233 High
LLC GREENHOUSE COMPLEX ZELENAYA LINIYA
INN 7826084060 Krasnodar territory
836,7 2 877,3 244 17,90 36,25 223 High
LLC AGRO-KOM
INN 0701002574 The Kabardino-Balkar Republic
71,1 404,6 94 62,36 33,06 281 High
LLC AGRICULTURAL COMPLEX OLYMSKY
INN 4608005786 Kursk region
281,6 1 250,0 129 61,67 28,06 212 High
JSC AGROINDUSTRIAL COMPLEX BELORECHENSKY
INN 6639009424 Sverdlovsk region
134,0 977,8 100 12,95 15,83 202 High
JSC AGRICULTURAL COMPLEX MOSKOVSKY
INN 5003003432 Moscow
159,4 3 026,7 96 19,23 11,86 246 High
JSC SOVHOZ (STATE FARM) TEPLICHNY
INN 6501254511 Sakhalin region
122,5 887,7 122 6,11 7,99 220 High
LLC AGRICULTURAL ENTERPRISE TEPLITSY BELOGORYA
INN 3123227670 Belgorod region
380,6 645,8 178 -17,13 3,05 320 Satisfactory
JSC AGROTEKHNIKA
INN 4716002207 Leningrad region
-50,5 486,9 79 10,10 0,05 550 Unsatisfactory
FSUE DALNEVOSTOCHNOE
INN 2502003633 Primorie territory
2,4 407,6 113 -5,16 -0,73 245 High

JSC AGRICULTURAL COMPLEX TEPLICHNY has shown the highest product profitability ratio 80,19%. Enterprise with the largest revenue for 2015 - JSC AGRICULTURAL COMPLEX MOSKOVSKY takes sixth place of the ranking. Its share in total revenue volume of TOP-10 companies is 25%. This enterprise turned out to be among three companies of the TOP-10 list, showing decrease in profit and revenue of 2015 compared to the previous year. FSUE DALNEVOSTOCHNOE has got negative values of product profitability both in 2014 and in 2015.

Summarizing the financial and other indicators, eight out of TOP-10 companies have got high solvency index Globas-i. This demonstrates their ability to pay off the debts in time and to the full extent.

LLC AGRICULTURAL ENTERPRISE TEPLITSY BELOGORYA has got satisfactory solvency index Globas-i due to the information about company being a defendant in debt collection arbitration proceedings.

JSC AGROTEKHNIKA has got unsatisfactory solvency index Globas-i due to the information about bankruptcy claim as well as being a defendant in debt collection arbitration proceedings.

The average product profitability value among TOP-10 companies in 2015 is 21,56%, compared to 23,01% in 2014 . Four enterprises shown decrease in product profitability value.

Picture 1. Product profitability and revenue of vegetable production enterprises (TOP-10)
Product profitability and revenue of vegetable production enterprises (TOP-10)

Total revenue volume of TOP-10 companies in 2015 is 12,1 bln RUB, that is 24% higher than in 2014. Total net profit of this group for the same period increased more than 86%.

In general, enterprises operate profitably. The industry demonstrates positive dynamics in vegetables production, that is proved by the data of the Federal State Statistics Service (Rosstat)(Picture 2,3).

Picture 2. Stock of potato on the end of the accounting period (annual value, th tons)
Stock of potato on the end of the accounting period (annual value, th tons)


Picture 3. Stock of vegetables and gourds on the end of the accounting period (annual value, th tons)
Stock of vegetables and gourds on the end of the accounting period (annual value, th tons)

Vegetables producing companies are located in regions with the best environment for agricultural production and also attracted to the largest distribution areas – Moscow and Saint-Petersburg. According to the data of the Information and analytical system Globas-i, 100 largest companies in terms of revenue volume for 2014 are registered in 44 regions. Most of them are registered in the following regions (TOP-6 regions):

RegionNumber of companies
Moscow region 10
Bryansk region 7
Samara region 6
The Republic of Bashkortostan 5
Leningrad region 4
Stavropol territory 4