Information Agency Credinform has prepared the ranking of the largest companies of Moscow's real economy. The largest enterprises (TOP-1000 and TOP-10) in terms of annual revenue were selected according to the data from the Statistical Register for the available periods (from 2007 to 2016). Then the companies were ranged by ROI ratio (Table 1). The analysis was based on data of the Information and Analytical system Globas.
Return on investments (%) is the ratio of net profit (loss) and net assets value. It demonstrates the return level from each ruble, received from the investments. In other words it shows how many monetary units the company used to obtain one monetary unit of net profit. The ratio is used for the assessment of fund raising at interest.
In general, normative values for ROI ratio are not set as they are changing due to the industry in which company operates.
For the most full and fair opinion about the company’s financial position, the whole set of financial indicators and ratios of the company should be taken into account.
Name, INN, region | Revenue, bln RUB | Net profit, bln RUB | ROI ratio, % | Solvency index Globas | |||
2015 | 2016 | 2015 | 2016 | 2015 | 2016 | ||
LLC LUKOIL-REZERVNEFTEPRODUKT INN 7709825967 Wholesale of solid, liquid and gaseous fuels and related products |
400,9 | 320,7 | 5,0 | 4,7 | 49,98 | 48,60 | 215 Strong |
PAO AEROFLOT INN 7712040126 Passenger air transport |
366,3 | 427,9 | -18,9 | 30,6 | -38,04 | 38,08 | 168 Superior |
LA SOCIETE A RESPONSABILITE LIMITEE AUCHAN INN 7703270067 Retail sale in non-specialised stores with food, beverages or tobacco predominating |
344,2 | 333,1 | 11,9 | 10,9 | 23,23 | 18,35 | 237 Strong |
LLC ALFA DIRECT SERVICE INN 7728308080 Legal and accounting activities |
603,2 | 756,2 | 0,3 | 0,2 | 22,32 | 16,94 | 186 High |
Oil Transporting Joint-Stock Company Transneft INN 7706061801 Oil and oil products transportation via pipelines |
756,9 | 803,1 | 12,8 | 30,6 | 7,74 | 16,69 | 158 Superior |
NAO TRADE HOUSE PEREKRIOSTOK INN 7728029110 Retail sale in non-specialised stores with food, beverages or tobacco predominating |
726,4 | 848,3 | 18,0 | 10,6 | 14,39 | 7,82 | 211 Strong |
PAO ROSNEFT OIL COMPANY INN 7706107510 Extraction of crude petroleum |
3 831,1 | 3 930,1 | 239,4 | 99,2 | 16,67 | 6,47 | 188 High |
PAO GAZPROM INN 7736050003 Wholesale of solid, liquid and gaseous fuels and related products |
4 334,3 | 3 934,5 | 403,5 | 411,4 | 4,33 | 3,95 | 141 Superior |
PAO RUSSIAN RAILWAYS INN 7708503727 Activities of railway transport |
1 510,8 | 1 577,5 | 0,3 | 6,5 | 0,01 | 0,15 | 179 High |
NAO ROSNEFTEGAZ INN 7705630445 Holding companies management activities |
79,5 | 800,4 | 149,4 | -90,4 | 5,28 | -2,83 | 286 Medium |
Total for TOP-10 group of companies | 12 953,5 | 13 731,7 | 821,6 | 514,4 | |||
Average value within TOP-10 group of companies | 1 295,4 | 1 373,2 | 82,2 | 51,4 | 10,59 | 15,42 | |
Average value within TOP-1000 group of companies | 37,2 | 41,5 | 2,0 | 2,9 | 622,91 | 495,61 |
The average value of ROI ratio within TOP-10 group of companies is significantly lower than average value of TOP-1000 companies.
In 2016, only three companies from TOP-10 list increased the revenue and net profit in comparison with 2015. The companies with decrease in net profit, revenue, ROI ratio are marked red in columns 2-7 of Table 1.
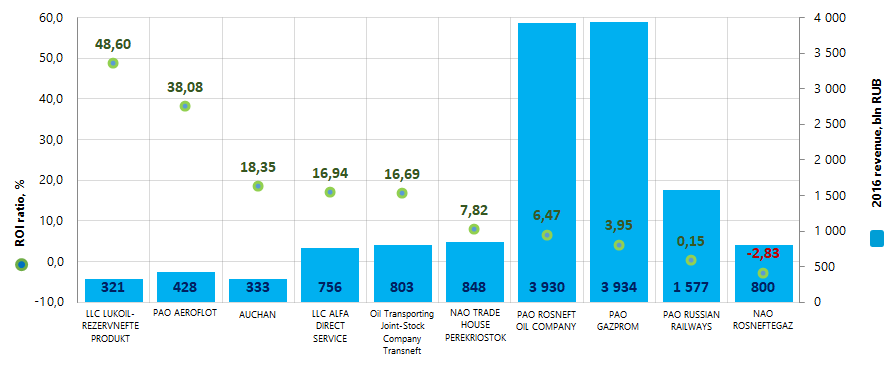
For the last 3 years, the average values of ROI ratio showed increasing trend (Picture 2).
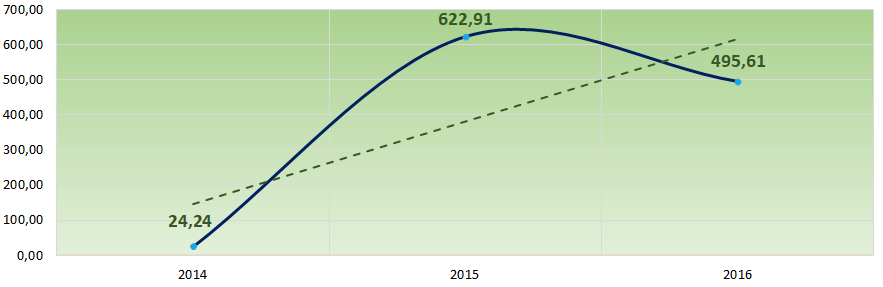
All companies from TOP-10 list have the upper levels of solvency index Globas, this fact shows the ability of the companies to meet their obligations in time and fully.
In 2017 all-time peak of air passengers number was recorded: 105 mln passengers.
Transfer intensity and passenger traffic volume are indicative of the country’s economic climate and human wellbeing. When there is an economic downturn, demand for air tickets drops – first for holiday trips being a product of deferred demand, and then for business flights.
105 mln travelers used Russian airports in 2017, that is by 15,4% higher than in 2016. Speaking about the Soviet period, the highest number of passengers was recorded in 1990 – 91 mln, and then there was a reduction up to 1999 when airports have served only 22 mln people. As the GDP grew, the positive dynamics of air carriage was restored but fall under crisis of 2008 and 2015-2016 though (see Picture 1).
Following the results of January 2018, air companies transferred 13,5% more passengers than in January 2017: 7,5 mln and 6,5 mln respectively. If the trend of growth continues this year, increase in annual rate up to 119 mln people should be expected.
Increased ridership is beneficial to ratings of key airports in the RF. Top-10 of the largest air harbors record a considerable increase in the number of served passengers (arrived and departured). However, airport in Simferopol became an exception with a small decrease to the level of 2016 that can be explained by resumed flights to Turkey after a one-year ban.
Vnukovo Airport demonstrated the highest increase (30,1% up to 18,1 mln passengers) and became the 3rd in the top. Koltsovo in Yekaterinburg also made a huge dynamics: plus 26% up to 5,4 mln. St. Petersburg Pulkovo Airport increased transfer by 21,6% up to 16,1 mln people.
Sheremetyevo, the leading air gate of Russia, is the first among all domestic airports to surpass the mark of 40 mln arrived and departured passengers. This figure allowed the airport to become 11th in Europe and be included in Top-50 of major hub airports of the world. For reference: being the largest airport in the Old World, London Heathrow served 78 mln people in 2017; Hartsfield-Jackson Atlanta International Airport (the USA), the world’s only airport with ridership over 100 mln passengers per year, served 104 mln.
All Top-10 airports placed all-time high number of served passengers, excluding Domodedovo with record 33 mln in 2014 and Simferopol with 5,2 mln in 2016 and 1991.
Because of growth in demand for travels, airline and routs network is expectedly growing. Table 1 contains information about flights that will be opened this spring. From Sheremetyevo since March 1, 2018 Air Arabia will transfer to Sharjah (UAE). Flights to Casablanca will be voyaged by Royal Air Maroc from March 26 from Domodedovo. Flight map from Pulkovo is significantly grown: London, Pisa, Pula, Teheran, Alicante, Izmir, Chongqing – here is a partial list of routes to be opened in spring. Like capital air hubs, regional airports also developed new points of destination.
Position in Russia (Europe) | Airport | Number of served passengers in 2017, mln people | Growth rate of number of served passengers to 2016, % | Air company and new destinations of spring 2018 | ||
Air company | Destination | Starting date | ||||
1 (11) | Sheremetyevo (Moscow) | 40,1 | 17,8 | Aeroflot | Saransk | 01.05 |
Air Arabia | Sharjah (UAE) | 01.03 | ||||
Cobalt Air | Larnaca (Cyprus) | 26.03 | ||||
Ellinair | Chania (Greece) | 29.04 | ||||
Kavala (Greece) | 28.05 | |||||
Rhodes (Greece) | 30.05 | |||||
Ural Airlines | Simferopol | 25.03 | ||||
Sochi | ||||||
Yekaterinburg | ||||||
2 (13) | Domodedovo (Moscow) | 30,7 | 7,6 | Aegean Airlines | Kerkyra (Greece) | 28.04 |
Royal Air Maroc | Casablanca (Morocco) | 26.03 | ||||
S7 Airlines | Tenerife (Spain) | 26.04 | ||||
Saratov airlines | Krasnoyarsk | 27.04 | ||||
3 (31) | Vnukovo (Moscow) | 18,1 | 30,1 | Pobeda | Kaliningrad | 26.03 |
Innsbruck (Austria) | 02.03 | |||||
Utair | Kaluga | 07.03 | ||||
Azimut | Grozny | 01.05 | ||||
Krasnodar | ||||||
4 (34) | Pulkovo (Saint-Petersburg) | 16,1 | 21,6 | Rossiya Airlines | London (Great Britain) | 25.03 |
Air Malta | Malta (Malta) | 30.03 | ||||
Germania | Dresden (Germany) | 26.04 | ||||
I-Fly | Antalya (Turkey) | 27.05 | ||||
Iran Air | Teheran (Iran) | 25.03 | ||||
Pobeda | Gyumri (Armenia) | 18.04 | ||||
Kaliningrad | ||||||
Naberezhnye Chelny | 27.03 | |||||
Tbilisi (Georgia) | 28.03 | |||||
S7 Airlines | Alicante (Spain) | 28.04 | ||||
Barcelona (Spain) | 27.04 | |||||
Perm | 30.04 | |||||
Pisa (Italy) | 27.03 | |||||
Pula (Croatia) | 27.05 | |||||
SunExpress | Izmir (Turkey) | 18.05 | ||||
Tianjin Airlines | Chongqing (China) | 01.04 | ||||
Ural Airlines | Frankfurt (Germany) | 26.03 | ||||
Utair | Kaluga | 02.04 | ||||
5 | Sochi | 5,7 | 8,0 | airBaltic | Riga (Latvia) | 14.05 |
Ural Airlines | Moscow | 25.03 | ||||
Utair | Kaluga | 03.04 | ||||
6 | Koltsovo (Yekaterinburg) | 5,4 | 26,0 | Air Moldova | Kishinev (Moldova) | 28.04 |
Corendon Airlines | Antalya (Turkey) | 01.05 | ||||
Pobeda | Krasnodar | 25.03 | ||||
Ural Airlines | Moscow | 25.03 | ||||
Bologna (Italy) | 21.04 | |||||
7 | Simferopol | 5,1 | -1,4 | Ural Airlines | Moscow | 25.03 |
Rostov-on-Don | 26.05 | |||||
8 | Tolmachevo (Novosibirsk) | 5,0 | 22,2 | I-Fly | Antalya (Turkey) | 28.05 |
S7 Airlines | Beloyarskiy | 03.05 | ||||
Kazan | 29.04 | |||||
Kogalym | 02.05 | |||||
Minsk (Belarus) | ||||||
Nadym | 01.05 | |||||
Pavlodar (Kazakhstan) | 30.05 | |||||
Samara | 27.04 | |||||
Tbilisi (Georgia) | 28.04 | |||||
Ufa | ||||||
Globus Airlines | Larnaca (Cyprus) | 01.05 | ||||
9 | Pashkovsky (Krasnodar) | 3,5 | 17,0 | Ellinair | Kerkyra (Greece) | 28.05 |
Pobeda | Yekaterinburg | 25.03 | ||||
Turkish Airlines | Istanbul (Turkey) | 08.05 | ||||
Utair | Kaluga | 01.04 | ||||
10 | Ufa | 2,8 | 21,4 | S7 Airlines | Novosibirsk | 26.04 |
Aviation service market is an indicator of situation in economy, because recession has a negative impact on air transfer too. Under crisis, air companies continue to operate due to the government or “rich” shareholders support. Private air companies are profitable only at increasing demand, working with numbers and developing new routes. That is confirmed by Transaero, formerly the second domestic carrier, failed after the rouble devaluation and dramatic reduction in overseas trips.
Expanding flight geography, our air harbors could be a part of the global market and eventually become not air hubs focused mainly on local tourism, but transnational transit hubs. Development of domestic destinations, sometimes being lossmaking, is mandatory condition for economic growth, because such a huge state as Russia cannot be connected together without it.