Trends in sugar production
Information agency Credinform has prepared a review of trends of the largest companies engaged in sugar production.
The largest enterprises (TOP-10 and TOP-100) in terms of annual revenue were selected for the analysis according to the data from the Statistical Register for the latest available periods (2015-2017). The analysis was based on the data of the Information and Analytical system Globas.
Net assets are total assets less total liabilities. This indicator reflects the real value of the property of an enterprise. When the company’s debt exceeds the value of its property, the indicator is considered negative (insufficiency of property).
The largest company in term of net assets is JSC SUGAR PLANT LENINGRADSKY. In 2018, net assets value of the company exceeded 5,8 billion RUB.
The lowest net assets volume among TOP-100 belonged to LLC SUGAR PLANT KOLPNYANSKY. In 2018, insufficiency of property of the company was indicated in negative value of -2,3 billion RUB.
Covering the ten-year period, the average net assets values have a trend to increase (Picture 1).
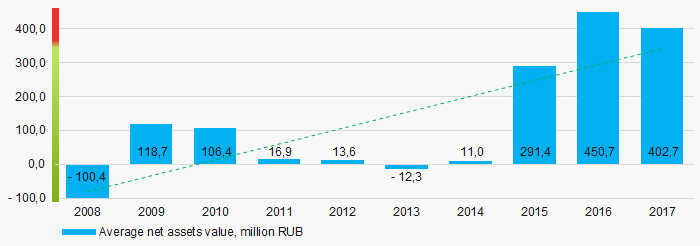 Picture 1. Change in average net assets value in 2008 – 2017
The shares of TOP-100 companies with insufficient property have trend to increase over the past three years (Picture 2).
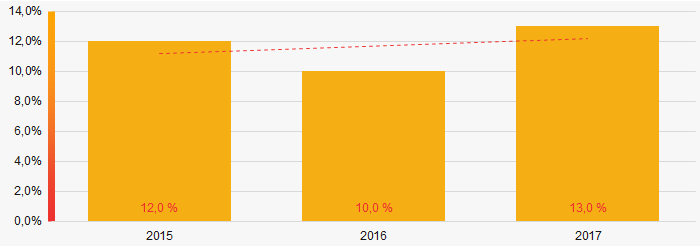 Picture 2. Shares of companies with negative net assets value in TOP-100, 2015-2017
Sales revenue
In 2017, total revenue of 10 largest companies of was 39% of TOP-100 total revenue (Picture 3). This testifies high level of monopolization in the industry.
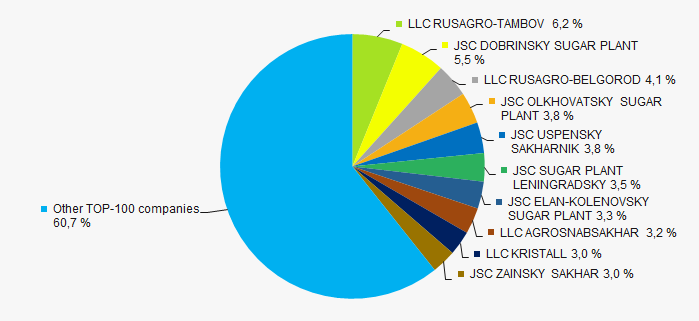 Picture 3. Shares of TOP-10 companies in TOP-100 total profit for 2017
Covering the ten-year-period, there is an increase in industry average revenue (Picture 4).
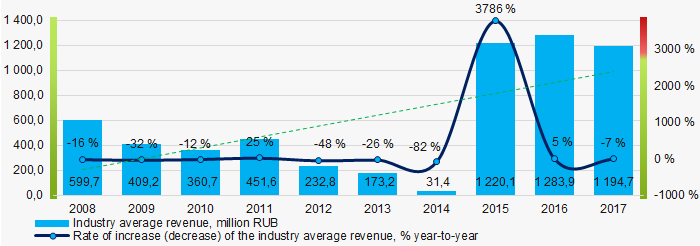 Picture 4. Change in industry average net profit in 2008-2017
Profit and loss
The largest company in term of net profit is JSC USPENSKY SAKHARNIK. The company’s profit for 2018 amounted to 1,2 billion RUB. Over the ten-year period, there is a trend to increase in average net profit (Picture 5).
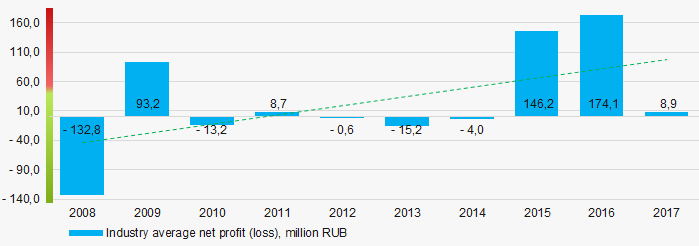 Picture 5. Change in industry average net profit values n 2008-2017
For the three-year period, the average net profit values of TOP-100 companies decreased with the average net loss value having the increasing trend (Picture 6).
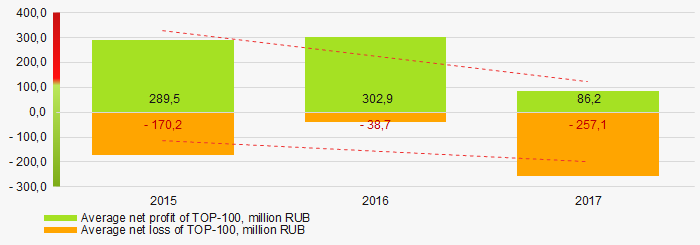 Picture 6. Change in average net profit and net loss of ТОP-100 in 2015 – 2017
Key financial ratios
For the ten-year period, the average values of the current liquidity ratio were often below the recommended one - from 1,0 to 2,0 with a trend to increase (Picture 7).
Current liquidity ratio (current assets to short-term liabilities) shows the sufficiency of company’s assets to repay on short-term liabilities.
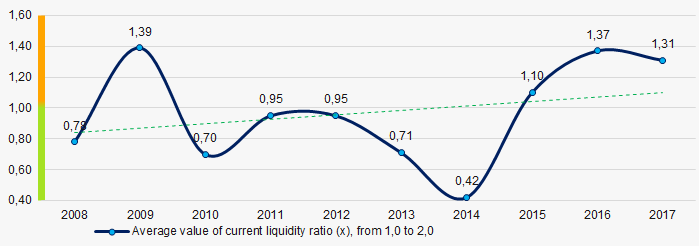 Picture 7. Change in industry average values of current liquidity ratio in 2008 – 2017
For the ten-year period, the average values of ROI ratio were on a quite high level with a trend to decrease (Picture 8).
ROI ratio is calculated as net profit to sum of shareholders equity and long-term liabilities, and shows the return of equity involved in commercial activities and long-term borrowed funds.
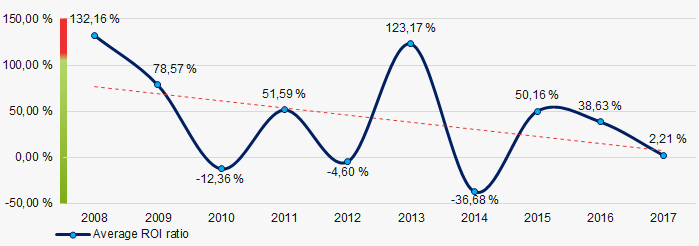 Picture 8. Change in average values of ROI ratio in 2008 – 2017
Assets turnover ratio is the ratio of sales revenue and company’s average total assets for a period. It characterizes the effectiveness of using of all available resources, regardless the source of their attraction. The ratio shows how many times per year the full cycle of production and circulation is performed, generating the corresponding effect in the form of profit.
For the ten-year period, business activity ratio demonstrated the increasing trend (Picture 9).
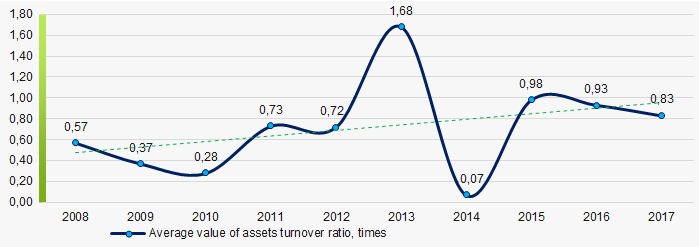 Picture 9. Change in average values of assets turnover ratio in 2008 – 2017
Small enterprises
35% companies of TOP-100 are registered in the Register of small and medium-sized enterprises of the Federal Tax Service of the Russian Federation. At the same time, their share in total revenue for 2017 slightly exceeded 2% that is significantly lower than the national average figure (Picture 10).
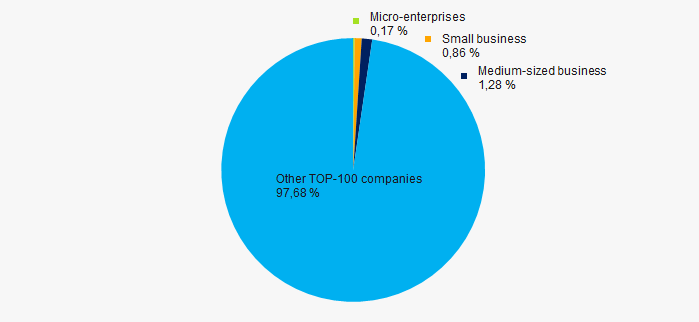 Picture 10. Shares of small and medium-sized enterprises in TOP-100, %
Main regions of activity
Companies of TOP-1000 are registered in 35 regions of Russia and located across the country quite unequally, taking into account the geographical location of raw material sources. Over 58% of their turnover is concentrated in Krasnodar territory, Voronezh, Lipetsk and Tambov regions (Picture 11).
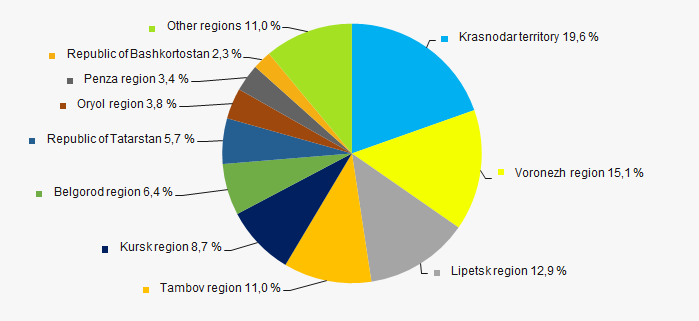 Picture 11. Distribution of TOP-100 revenue by regions of Russia
Financial position score
Assessment of the financial position of TOP-100 companies shows that the majority of them have stable financial position (Picture 12).
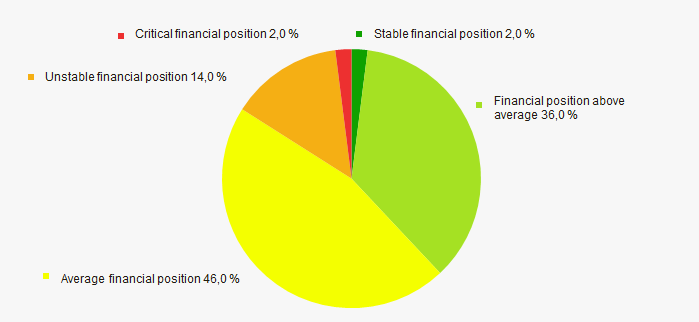 Picture 12. Distribution of TOP-100 companies by financial position score
Solvency index Globas
Most of TOP-100 companies got Superior / High and Strong / Medium index Globas. This fact shows their ability to meet their obligations fully (Picture 13).
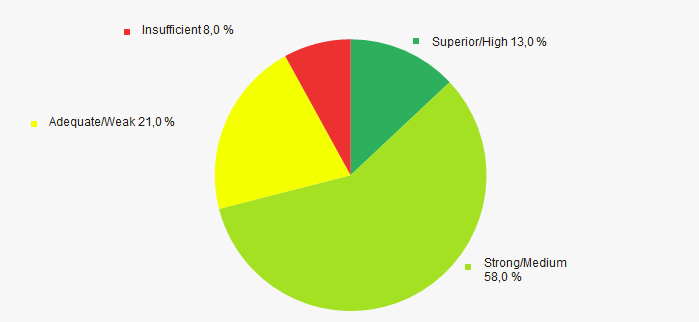 Picture 13. Distribution of TOP-100 companies by solvency index Globas
Conclusion
Complex assessment of activity of the largest Russian companies engaged in sugar production, taking into account the main indexes, financial ratios and indicators, demonstrates the prevalence of positive trends (Table 1).
| Trends and evaluation factors | Relative share of factors, % |
| Rate of growth (decline) in the average size of net assets |  10 10 |
| Increase / decrease in the share of enterprises with negative values of net assets |  -10 -10 |
| Rate of growth (decline) in the average size of revenue |  10 10 |
| Level of competition |  -5 -5 |
| Rate of growth (decline) in the average size of profit (loss) |  10 10 |
| Growth / decline in average values of companies’ net profit |  -10 -10 |
| Growth / decline in average values of companies’ net loss |  -10 -10 |
| Increase / decrease in average values of total liquidity ratio |  5 5 |
| Increase / decrease in average values of return on investment ratio |  -10 -10 |
| Increase / decrease in average values of asset turnover ratio, times |  10 10 |
| Share of small and medium-sized businesses in the region in terms of revenue being more than 22% |  -10 -10 |
| Regional concentration |  5 5 |
| Financial position (the largest share) |  5 5 |
| Solvency index Globas (the largest share) |  10 10 |
| Average value of relative share of factors |  0,7 0,7 |
 positive trend (factor) ,
  negative trend (factor).
Inventory turnover of sugar manufacturers
Information Agency Credinform has prepared the ranking of inventory turnover of sugar manufacturers. The largest enterprises in terms of revenue volume (TOP-10) were selected according to the data from the Statistical Register for the latest available periods (2015 - 2017). Then they were ranked by decrease in inventory turnover ratio (Table 1). The analysis was made on the basis of the data of the Information and Analytical system Globas.
Inventory turnover (times) is a ratio of revenue to average value of inventories for a period. The ratio shows rate of inventory realization.
Inventory turnover characterises mobility of funds that the company invests in inventories: the faster monetary funds invested in inventories are regained in the form of revenue from sale of finished products, the higher is business activity and efficiency of the recources use with time effect.
There are no recommenmded values for this indicator, because they vary strongly depending on the industry. The higher is value, the better. The experts of the Information agency Credinform, taking into account the actual situation both in the economy as a whole and in sectors, has developed and implemented in the Information and Analytical system Globas the calculation of practical values of financial ratios that can be recognized as normal for a particular industry. For sugar producing companies the practical value of inventory turnover ratio was from 3,01 in 2017.
For getting of the most comprehensive and fair picture of the financial standing of an enterprise it is necessary to pay attention to all combination of indicators and financial ratios.
| Name, INN, region | Revenue, billion RUB | Net profit (loss), billion RUB | Inventory turnover, times | Solvency index Globas | |||
| 2016 | 2017 | 2016 | 2017 | 2016 | 2017 | ||
| 1 | 2 | 3 | 4 | 5 | 6 | 7 | 8 |
| LLC RUSAGRO-BELGOROD INN 3126019943 Belgorod region |
 9,67 9,67 |
 6,76 6,76 |
 0,94 0,94 |
 0,13 0,13 |
 15,76 15,76 |
 11,30 11,30 |
249 Strong |
| LLC RUSAGRO-TAMBOV INN 6804008674 Tambov region |
 10,78 10,78 |
 10,15 10,15 |
 1,25 1,25 |
 0,08 0,08 |
 9,67 9,67 |
 9,00 9,00 |
222 Strong |
| LLC AGROSNABSAKHAR INN 4826050108 Lipetsk region |
 5,11 5,11 |
 5,28 5,28 |
 0,08 0,08 |
 -0,92 -0,92 |
 3,58 3,58 |
 4,43 4,43 |
254 Medium |
| JSC LENINGRADSKY SUGAR PLANT INN 2341006687 Krasnodar territory |
 7,09 7,09 |
 5,72 5,72 |
 1,19 1,19 |
 0,42 0,42 |
 4,35 4,35 |
 4,05 4,05 |
210 Strong |
| JSC USPENSKIY SAHARNIK INN 2357005329 Krasnodar territory |
 6,81 6,81 |
 6,21 6,21 |
 1,87 1,87 |
 1,18 1,18 |
 3,87 3,87 |
 2,98 2,98 |
183 High |
| LLC KRISTALL INN 6824004406 Tambov region |
 6,08 6,08 |
 4,91 4,91 |
 0,15 0,15 |
 0,01 0,01 |
 2,74 2,74 |
 2,91 2,91 |
269 Medium |
| JSC Olkhovatsky Sugar Factory INN 3618003708 Voronezh region |
 6,51 6,51 |
 6,35 6,35 |
 1,79 1,79 |
 0,30 0,30 |
 2,48 2,48 |
 2,47 2,47 |
188 High |
| JSC Zainsky Sakhar INN 1647008721 The Republic of Tatarstan |
 4,60 4,60 |
 4,89 4,89 |
 0,46 0,46 |
 0,01 0,01 |
 2,64 2,64 |
 2,14 2,14 |
233 Strong |
| JSC SUGAR PLANT DOBRINSKI INN 4804000086 Lipetsk region |
 11,24 11,24 |
 9,10 9,10 |
 1,61 1,61 |
 0,35 0,35 |
 2,74 2,74 |
 2,02 2,02 |
198 High |
| JSC ELAN-KOLENOVSKII SUGAR PLANT INN 3617006819 Voronezh region |
 5,28 5,28 |
 5,46 5,46 |
 1,72 1,72 |
 0,59 0,59 |
 1,89 1,89 |
 1,94 1,94 |
189 High |
| Total for TOP-10 companies |  73,18 73,18 |
 64,82 64,82 |
 11,04 11,04 |
 2,16 2,16 |
|||
| Average value for TOP-10 companies |  7,32 7,32 |
 6,48 6,48 |
 1,10 1,10 |
 0,22 0,22 |
 4,97 4,97 |
 4,32 4,32 |
|
| Average industrial value |  1,28 1,28 |
 1,19 1,19 |
 0,17 0,17 |
 0,01 0,01 |
 3,34 3,34 |
 3,01 3,01 |
|
 growth decrease of indicator to the previous period,
  decrease of indicator to the previous period.
The average indicator of the inventory turnover ratio of TOP-10 companies is above the industry average value and the practical one. In 2017 three companies out of TOP-10 have improved their indicators.
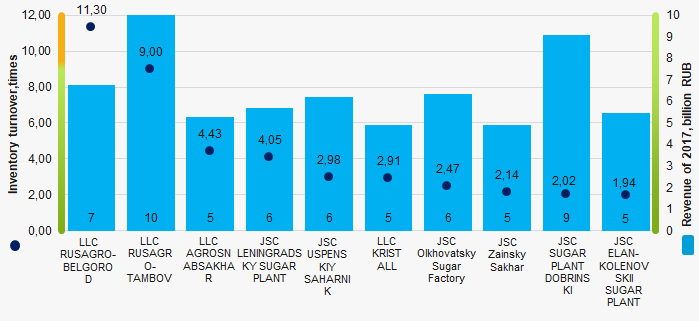 Picture 1. Inventory turnover ratio and revenue of the largest Russian sugar manufacturers (TOP-10)
Over a ten-year period the industry average indicators of the inventory turnover ratio have decreasing tendency. (Picture 2).
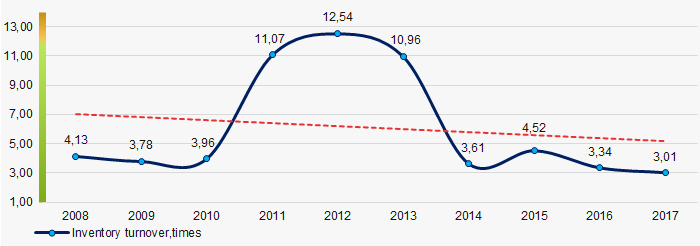 Picture 2. Change in the average industry values of the inventory turnover ratio of the largest Russian sugar manufacturers in 2008 – 2017