
Order a report
Custom-made industry research, company ratings, competitor analysis


Trends in the work of Perm companies
Information agency Credinform represents an overview of activity trends of the largest companies in the real sector of the economy of the Perm territory.
The enterprises with the largest volume of annual revenue of the real sector of the economy in the Stavropol territory (TOP-1000), were selected for the analysis, according to the data from the Statistical Register for the latest available periods (2013-2017). The analysis was made on the basis of the data of the Information and Analytical system Globas.
Net assets is an indicator, reflecting the real value of the property of an enterprise. It is calculated annually as the difference between assets on the balance sheet of the enterprise and its debt obligations. The indicator of net assets is considered negative (insufficiency of property), if company’s debt exceeds the value of its property.
| № | Name, INN, type of activity | Net assets value, bln RUB | Solvency index Globas | ||||
| 2013 | 2014 | 2015 | 2016 | 2017 | |||
| 1 | 2 | 3 | 4 | 5 | 6 | 7 | 8 |
| 1 | URALKALI PJSC INN 5911029807 Production of fertilizers and nitrogen compounds |
|
|
|
|
|
188 High |
| 2 | LUKOIL-PERM LLC INN 5902201970 Crude oil production |
|
|
|
|
|
199 High |
| 3 | LUKOIL-PERMNEFTEORGSINTEZ LLC INN 5905099475 Production of petroleum products |
|
|
|
|
|
196 High |
| 4 | METAFRAX PJSC INN 5913001268 Manufacture of other chemical organic basic substances |
|
|
|
|
|
143 High |
| 5 | GAZPROM TRANSGAZ TCHAIKOVSKY LLC INN 5920000593 Pipeline transportation of gas and products of its processing |
|
|
|
|
|
216 Strong |
| 996 | VERKHNEKAMYE-LES LLC INN 5981001072 Logging |
|
|
|
|
|
357 Adequate |
| 997 | INVESTSPETSPROM LLC INN 5904164851 Transfer of steam and hot water (thermal energy) |
|
|
|
|
|
321 Adequate |
| 998 | METALLURGICHESKII ZAVOD KAMASTAL LLC INN 5906044775 Production of raw steel Process of being wound up, 12.09.2018. |
|
|
|
|
|
600 Insufficient |
| 999 | PERMSKAYA SETEVAYA KOMPANIYA LLC INN 5904176536 Transfer of steam and hot water (thermal energy) |
|
|
|
|
|
290 Medium |
| 1000 | PJSC SPETSIALNOGO MASHINOSTROENIYA I METALLURGII MOTOVILIKHINSKIE ZAVODY INN 5906009273 Production of weapons and ammunition Process of being wound up, 30.03.2018 |
|
|
|
|
|
600 Insufficient |
![]() — growth of the indicator to the previous period,
— growth of the indicator to the previous period, ![]() — decline of the indicator to the previous period.
— decline of the indicator to the previous period.
The average values of net assets of TOP-1000 enterprises tend to increase over the five-year period (Picture 1).
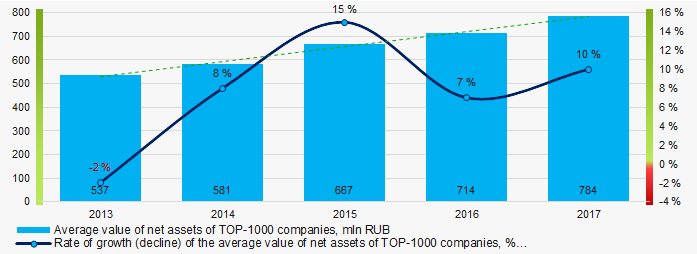 Picture 1. Change in the average indicators of the net asset value of TOP-1000 enterprises in 2013 – 2017
 The shares of TOP-1000 enterprises with insufficiency of assets have a tendency to increase in the last five years (Picture 2).
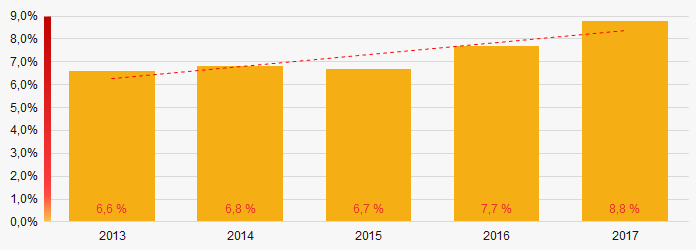 Picture 2. Share of enterprises with negative values of net assets in TOP-1000
Sales revenue
The revenue volume of 10 leading companies of the region made 52% of the total revenue of TOP-1000. (Picture 3). It points to a high level of capital concentration in the Perm territory.
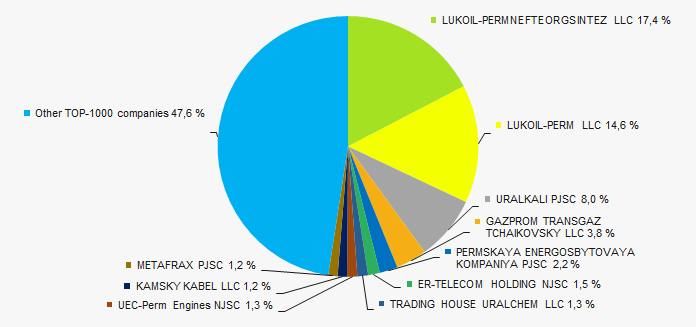 Picture 3. Shares of participation of TOP-10 companies in the total revenue of TOP-1000 enterprises for 2017
 In general, there is a trend towards an increase in revenue volume (Picture 4).
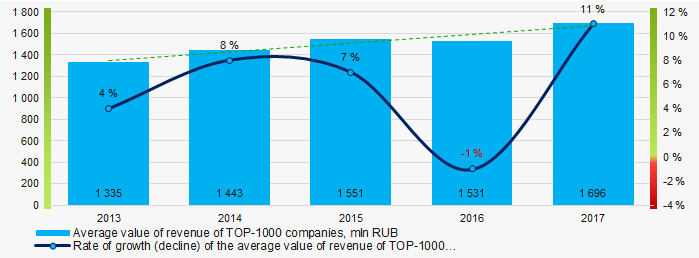 Picture 4. Change in the average revenue of TOP-100 enterprises in 2013 – 2017
Profit and losses
The profit volume of 10 industry leaders of the region made 79% of the total profit of TOP-1000 companies in 2017 (Picture 5).
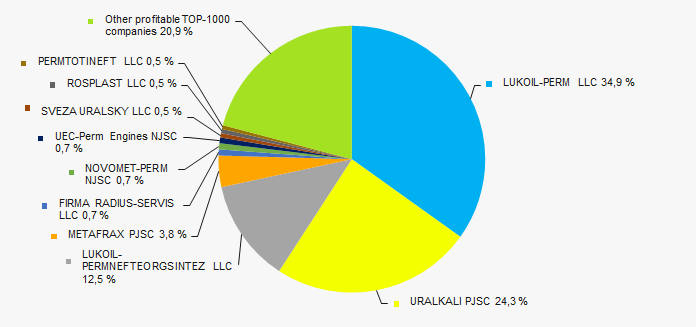 Picture 5. Shares of participation of TOP-10 companies in the total volume of profit of TOP-1000 enterprises for 2017
In general, average values of net profit’s indicators trend to increase over the five-year period (Picture 6).
 Picture 6. Change in the average values of net profit of TOP-1000 enterprises in 2013 – 2017
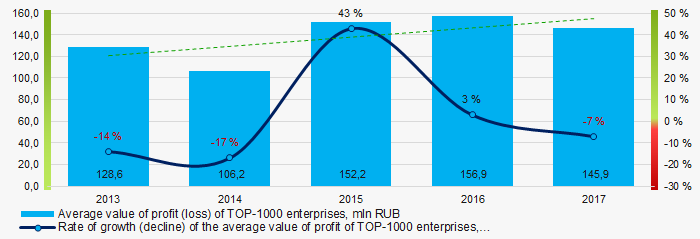
Average values of net profit’s indicators of TOP-1000 companies trend to increase for the five-year period, at the same time the average value of net loss also increases (Picture 7).
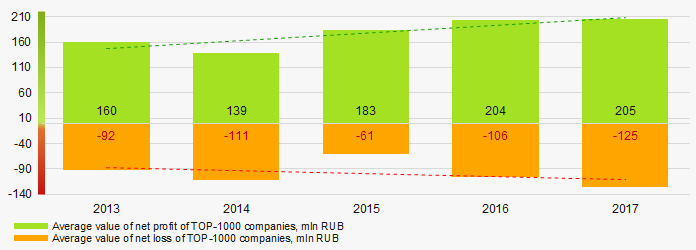 Picture 7. Change in the average values of indicators of net profit and net loss of TOP-1000 companies in 2013 – 2017
Key financial ratios
Over the five-year period the average indicators of the total liquidity ratio of TOP-1000 enterprises were above the range of recommended values - from 1,0 up to 2,0, with a tendency to increase (Picture 8).
The total liquidity ratio (the relation of the amount of current assets to short-term liabilities) shows the sufficiency of company’s funds for repayment of its short-term liabilities.
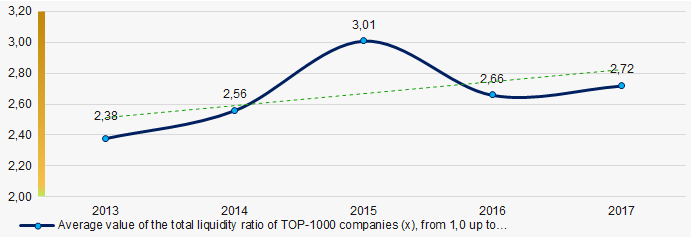 Picture 8. Change in the average values of the total liquidity ratio of TOP-1000 enterprises in 2013 – 2017
 There has been a high level of average values of the return on investment ratio for five years, especially in 2013 and 2017, with a tendency to increase (Picture 9).
The ratio is calculated as the relation of net profit to the sum of own capital and long-term liabilities and demonstrates the return on the equity of own capital involved in the commercial activity and the long-term borrowed funds of an organization.
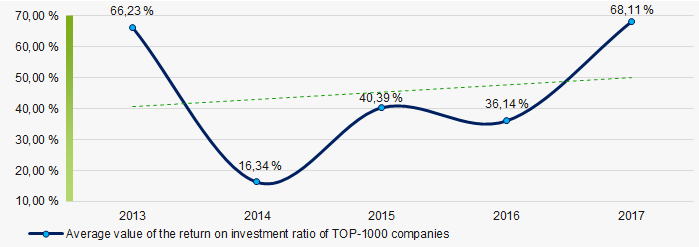 Picture 9. Change in the average values of the return on investment ratio of TOP-1000 enterprises in 2013 – 2017
Asset turnover ratiois calculated as the relation of sales proceeds to the average value of total assets for a period and characterizes the efficiency of use of all available resources, regardless of the sources of their attraction. The ratio shows how many times a year a complete cycle of production and circulation is made, yielding profit.
This ratio of business activity showed a tendency to decrease over the five-year period (Picture 10).
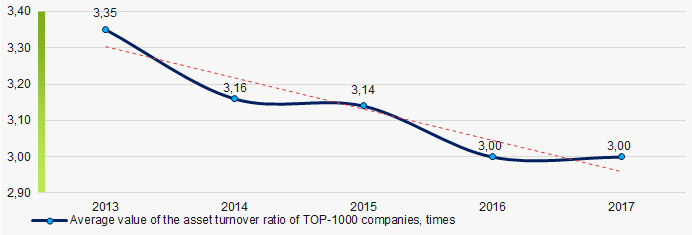 Picture 10. Change in the average values of the asset turnover ratio of TOP-1000 enterprises in 2013 – 2017
 Production structure
The largest shares in the total revenue of TOP-1000 are owned by companies, specializing in the manufacture of coke and petroleum products, crude oil production and wholesale (Picture 11).
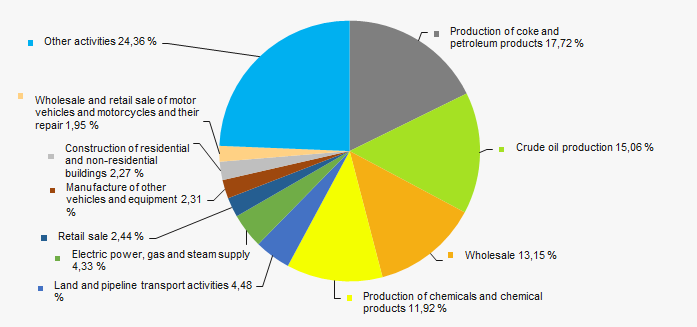 Picture 11. Distribution of types of activity in the total revenue of TOP-1000 companies, %
66% of TOP-1000 companies are registered in the Register of small and medium-sized businesses of the Federal Tax Service of the RF. At the same time, their share in the total revenue of TOP-1000 enterprises amounted to 14% (Picture 12).
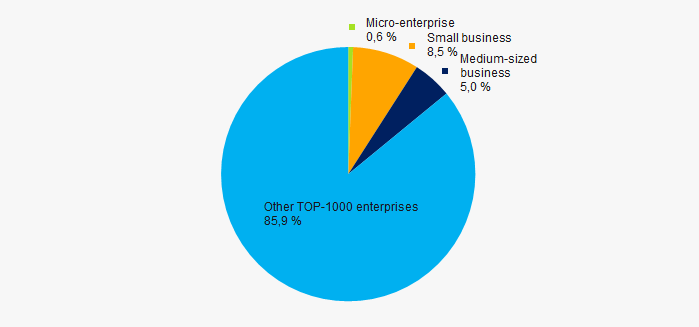 Picture 12. Shares of proceeds of small and medium-sized businesses in TOP-1000 companies
Main regions of activity
The TOP-1000 companies are distributed unequal in the Perm territory and registered in 39 regions and inhabited localities. 72% of the largest enterprises in terms of revenue are concentrated in the regional center - in Perm (Picture 13).
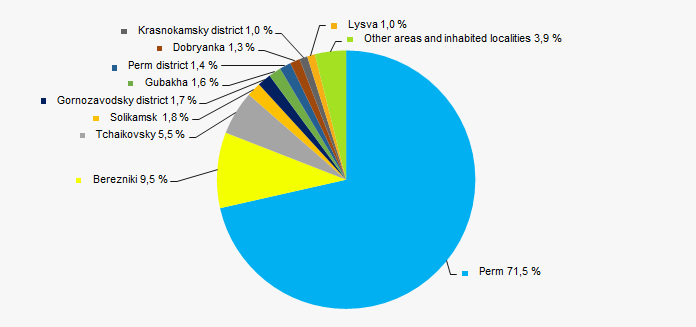 Picture 13. Distribution of the revenue of TOP-1000 companies by regions of Perm territory
 Financial position score
An assessment of the financial position of TOP-1000 companies shows that almost half of them are in a stable financial position and above average (Picture 14).
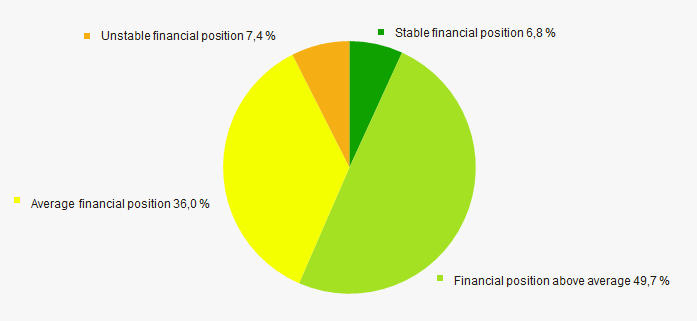 Picture 14. Distribution of TOP-1000 companies by financial position score
 Solvency index Globas
Vast majority of TOP-1000 companies got High or Strong/Medium Solvency index Globas, that points to their ability to pay off their debts in time and fully (Picture 15).
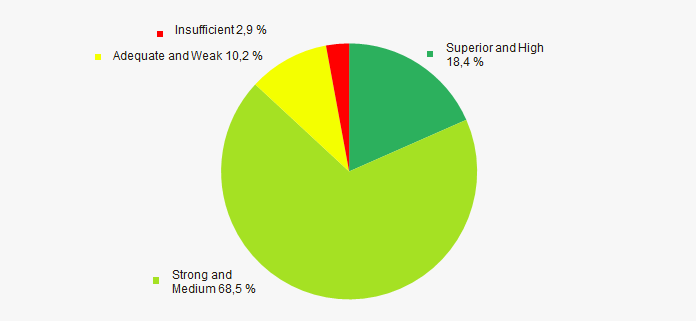 Picture 15. Distribution of TOP-1000 companies by solvency index Globas
Industrial production index
According to the Federal Service of State Statistics, there is a some growth trend to a decrease in the industrial production index in the Perm territory during 12 months of 2017 - 2018. For 10 months of 2018, the index decreased by an average of 1,8%, and in general, from November 2017 to October 2018, the decline averaged 0,2% (Picture 16).
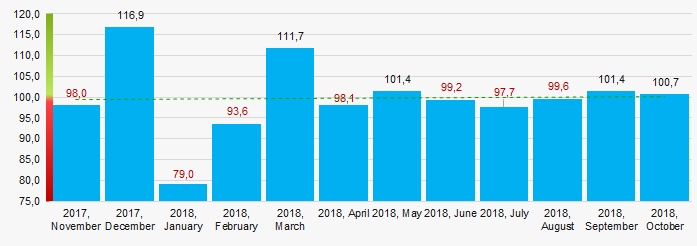 Picture 16. Industrial production index in Perm territory in 2017 - 2018, month to month (%)
According to the same information, the share of enterprises of the Perm territory in the amount of revenue from the sale of goods, works, services made 1,33% countrywide for 9 months of 2018.
Conclusion
A comprehensive assessment of activity of the largest companies in the real sector of the economy of the Perm territory, taking into account the main indices, financial indicators and ratios, points to the prevalence of positive trends (Table 2).
| Trend and evaluation factors of TOP-1000 enterprise | Specific share of factor, % |
| Rate of growth (decline) in the average size of net assets | |
| Increase / decrease in the share of enterprises with negative values of net assets | |
| Rate of growth (decline) in the average size of revenue | |
| Concentration level of capital | |
| Rate of growth (decline) in the average size of profit (loss) | |
| Growth / decline in average values of companies’ net profit | |
| Growth / decline in average values of companies’ net l | |
| Increase / decrease in average values of total liquidity ratio | |
| Increase / decrease in average values of return on investment ratio | |
| Increase / decrease in average values of asset turnover ratio, times | |
| Share of small and medium-sized businesses in the region in terms of revenue being more than 30% | |
| Regional concentration | |
| Financial position (the largest share) | |
| Solvency index Globas (the largest share) | |
| Industrial production index | |
| Average value of the specific share of factors | |
![]() — positive trend (factor),
— positive trend (factor), ![]() — negative trend (factor).
— negative trend (factor).