Trends in work of companies of Tula region
Information agency Credinform has observed trends in the activity of the largest companies of real sector of economy of Tula region.
Enterprises with the largest volume of annual revenue (TOP-1000), were selected for the analysis, according to the data from the Statistical Register for the latest available periods (for 2013-2017). The analysis was made on the basis of the data of the Information and Analytical system Globas.
Net assets - indicator, reflecting the real value of company's property, is calculated annually as the difference between assets on the enterprise balance and its debt obligations. The indicator of net assets is considered negative (insufficiency of property), if company’s debt exceeds the value of its property.
The largest company of Tula region in terms of net assets is JSC QUADRA - POWER GENERATION. In 2017 net assets of the company amounted to 33,1 billion RUB.
The smallest amount of net assets among TOP-1000 has LLC BRAER BRICKYARD. Insufficiency of property of the company has negative value -1,3 billion RUB.
Over a five-year period average amount of net assets of the TOP-1000 group has got increasing tendency (Picture 1).
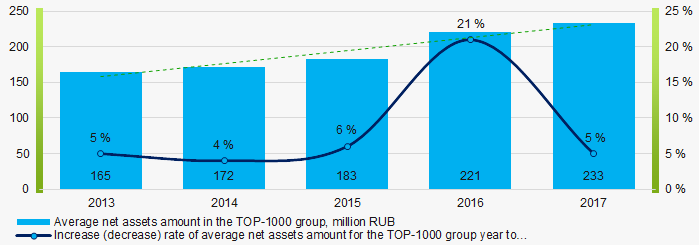 Picture 1. Change in TOP-1000 average indicators of the net asset amount in 2013 – 2017
Shares of companies with insufficiency of property in the TOP-1000 has increasing tendency for the last five years (Picture 2).
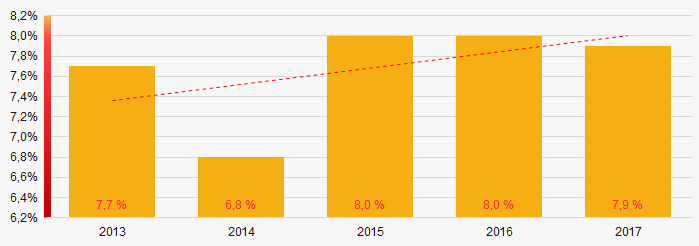 Picture 2. Shares of companies with negative value of net assets in TOP-1000
Sales revenue
The revenue of 10 leaders of the industry made 44% of the total revenue of TOP-1000 companies in 2017(Picture 3). It demonstrates high level of productive concentration in Tula region.
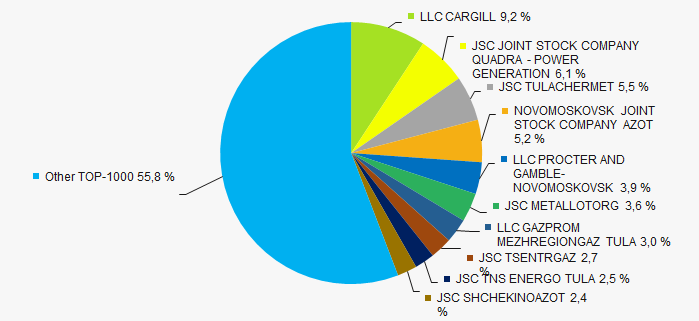 Picture 3. Shares of participation of TOP-10 companies in the total revenue of TOP-1000 companies for 2017
In general, an increasing tendency in volume revenue is observed (Picture 4).
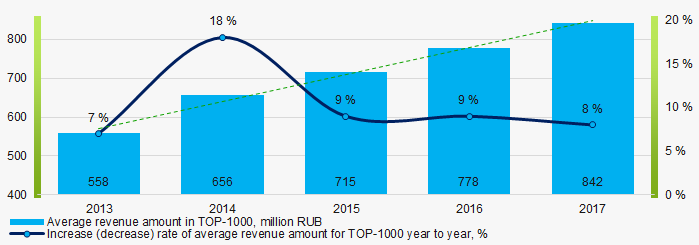 Picture 4. Change in the average revenue of TOP-1000 companies in 2013 – 2017
Profit and losses
The largest company of Tula region in terms of net profit is NOVOMOSKOVSK JOINT STOCK COMPANY AZOT. For 2017 profit of the company amounted to 10,7 billion RUB.
In general, increasing trend in average amount of profit in TOP-1000 has been observed for five years (Picture 5).
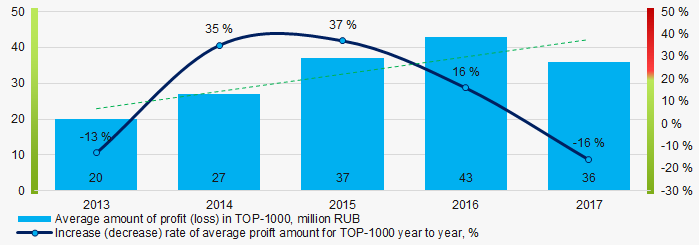 Picture 5. Change in average indicators of profit of TOP-1000 companies in 2013 – 2017
Over a five-year period, the average values of profit indicators of TOP-1000 companies tend to increase. Besides, the average value of net loss increases (Picture 6).
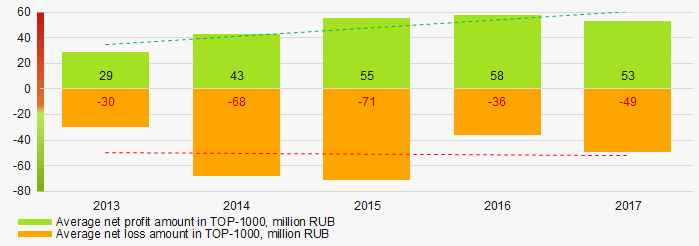 Picture 6. Change in the average indicators of profit and loss of TOP-1000 companies in 2013 – 2017
Key financial ratios
Over the five-year period the average indicators of the total liquidity ratio were above the range of recommended values – from 1,0 up to 2,0 with increasing tendency (Picture 7).
The total liquidity ratio (the relation of the amount of current assets to short-term liabilities) shows the sufficiency of company’s funds for repayment of its short-term liabilities.
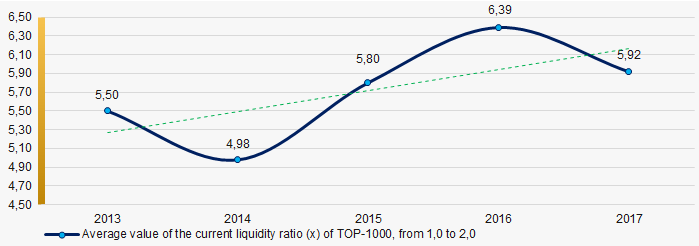 Picture 7. Change in the industry values of the total liquidity ratio of TOP-1000 companies in 2013 – 2017
In general, high level of average values of the indicators of the return on investment ratio with increasing tendency has been observed for five years. (Picture 8)
The ratio is calculated as the relation of net profit to the sum of own capital and long-term liabilities and demonstrates the return on the equity involved in the commercial activity of own capital and the long-term borrowed funds of an organization.
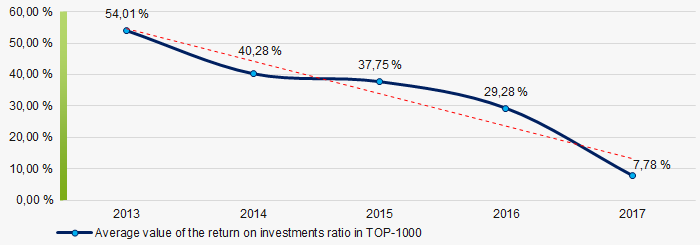 Picture 8. Change in the average values of the return on investment ratio of TOP-1000 companies in 2013 – 2017
Asset turnover ratio is calculated as the relation of sales revenue to the average value of total assets for a period and characterizes the efficiency of use of all available resources, regardless of the sources of their attraction. The ratio shows how many times a year a complete cycle of production and circulation is made, yielding profit.
This business activity ratio showed a tendency to decrease for five-year period (Picture 9).
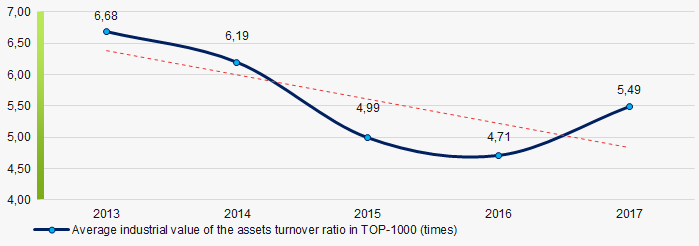 Picture 9. Change in the average values of the asset turnover ratio of TOP-1000 companies in 2013 – 2017
Small business
80% of TOP-1000 are registered in the Register of small and medium enterprises of the Tax Service of the RF. Besides, share of revenue in the total revenue of TOP-1000 companies amounts to 16,9%, that is lower than the average indicator for the country (Picture 10).
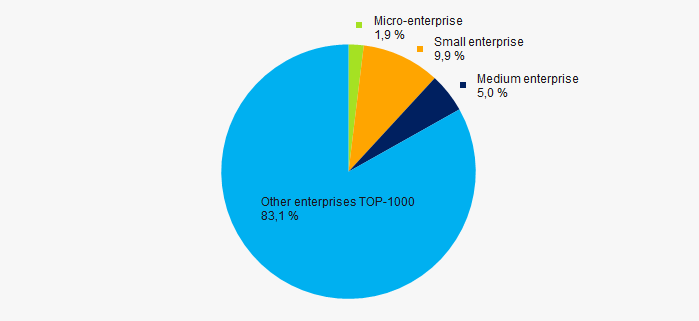 Picture 10. Shares of small and medium enterprises in TOP-1000 companies
Main regions of activity
TOP-1000 companies are registered in 26 districts and settlements of the region and unequally distributed along the territory of the region. More than 79% of the largest companies in terms of revenue volume are concentrated in regional center – Tula, Novomoskovskiy and Efremovskiy districts (Picture 11).
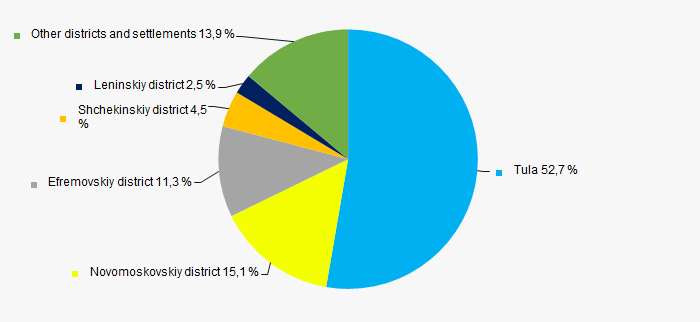 Picture 11. Distribution of revenue of TOP-1000 companies by districts of Tula region, %
Financial position score
An assessment of the financial position of TOP-1000 companies shows that the largest number is in a stable financial position and above the average (Picture 12).
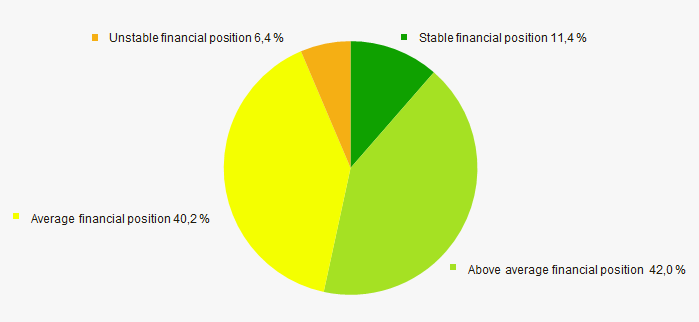 Picture 12. Distribution of TOP-1000 companies by financial position score
Solvency index Globas
Most of TOP-1000 companies got Superior/High or Medium Solvency index Globas, that points to their ability to repay their debts in time and fully (Picture 13).
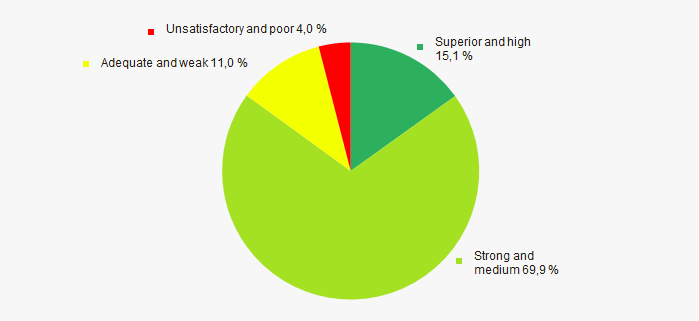 Picture 13. Distribution of TOP-1000 companies by solvency index Globas
Industrial production index
According to the Federal State Statistics Service, in Tula region during 12 months of 2018 - 2019 no clear trend of indicators for industrial production index has been observed (Picture 14). Besides, average indicator of the index from month to month amounted to 101,5%, and for 5 months of 2019 – 89,4%.
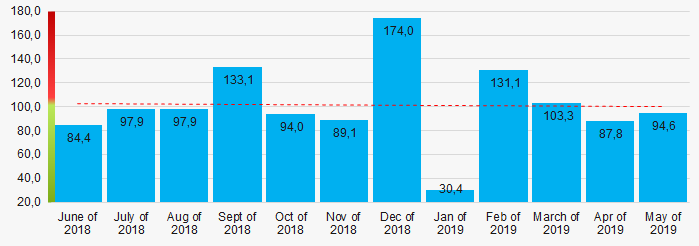 Picture 14. Industrial production index in Tula region in 2018 - 2019, from month to month (%)
According to the same data, share of Tula region companies in the total revenue volume from sale of goods, products, works, services for the country in 2018 amounted to 0,626%, for the 1st quarter of 2019 – 0,593%, that is lower than the indicator for the 1st quarter of 2018, amounted to 0,606%.
Conclusion
Comprehensive assessment of the activity of largest companies of real sector of economy of Tula region, taking into account the main indexes, financial indicators and ratios, demonstrates the presence of negative trends (Table 1).
| Trends and assessment factors for TOP-1000 | Share of factor, % |
| Rate of increase (decrease) of average amount of net assets |  10 10 |
| Increase / decrease of share of companies with negative values of net assets |  -10 -10 |
| Level of capital concentration |  -10 -10 |
| Increase (decrease) rate of average revenue amount |  10 10 |
| Increase (decrease) rate of average net profit (loss) amount |  10 10 |
| Increase / decrease of average net profit amount of TOP-1000 companies |  10 10 |
| Increase / decrease of average net loss amount of TOP-1000 companies |  -10 -10 |
| Increase / decrease of average industrial values of the current liquidity ratio |  5 5 |
| Increase / decrease of average industrial values of the return on investments ratio |  -10 -10 |
| Increase / decrease of average industrial values of the assets turnover ratio, times |  -10 -10 |
| Share of small and medium enterprises in the industry in terms of revenue volume more than 22% |  -10 -10 |
| Regional concentration |  -5 -5 |
| Financial position (major share) |  10 10 |
| Solvency index Globas (major share) |  10 10 |
| Industrial production index |  -5 -5 |
| Dynamics of share of companies in the total volume of revenue from sale of goods, products, works, services for the country |  -5 -5 |
| Average value of factors |  0,9 0,9 |
 positive trend (factor),
  negative trend (factor).
Top-10 basketball clubs of the VTB United League
The Information agency Credinform presents a ranking of the basketball clubs of the VTB United League by total assets. Using the Information and Analytical System Globas, the experts of the Agency selected Top-10 of basketball teams with the largest amount of assets. To get the total value of the assets of the club, its annual budget was taken into account. The experts also identified the most valuable players.
VTB United League is a basketball tournament created by VTB Bank and the Russian basketball federation in 2008. It unites the clubs from Russia, Kazakhstan, Belarus, Poland and Estonia and is the official FIBA1 tournament. It has the status of the championship of Russia.JSC Bank VTB is the primary sponsor.
VTB United League is the most prestigious and first in the division of professional basketball in Russia. The major trophy is the League Cup, played in the play-offs2. The predecessor of the VTB League was the Russian Basketball Championship, which was held from 1992 to 2008. Due to the constantly emerging problems with financing, most professional clubs began to go bankrupt, the championship participants and audience became less, and the popularization of basketball fell. Under the prevailing negative trend, it was decided to expand the boundaries of the competitions held; foreign clubs were invited, and the Russian Basketball Championship was held under the auspices of the VTB United League.
As in hockey, the value of a player is determined by his contract, i.e. the amount that a sports organization spends on paying a salary to a player while he plays for a club.
Transitions of players between clubs are possible only with the full consent of the players, moreover, the receiving party fully redeems the salary contract from the previous club. The financial conditions for each basketball player are individual and depend on many factors, so the procedure of such a transition is very difficult. Most often, the transition to other teams is carried out in the status of a free agent, i.e. at the moment when the contract expired and all obligations of the player to the club are fully fulfilled. Unlike hockey, in basketball most contracts are signed for one season. If the club is satisfied with the player, he is given the right to extend the employment contract, with the possibility of revising various conditions. Therefore, having 5-6 clubs per career is normal for most basketball players.
Another feature of the championship is that foreign clubs can not become champions of Russia in the regular competition. They can win the league only through the playoffs, winning the cup. If the first place in the regular championship will be taken by a foreign representative, the winner will be the domestic team with the highest points among Russian teams.
| Rank | Name | Balance sheet assets, million RUB | Club’s budget/Salary project, million RUB | Total assets value, million RUB | The most valuable player | |
| 1 | PBC CSKA Moscow |
800,0 | 2685,0 | 1551,5 | 3485,8 | Nando de Colo (157, 5 million RUB per year) |
| 2 | BC UNICS Kazan |
359,9 | 897,2 | 438,0 | 1257,1 | Jamar Smith (40 million RUB per year*3) |
| 3 | PBC Lokomotiv-Kuban Krasnodar |
333,3 | 1129,0 | 642,8 | 1462,3 | Dmitry Kulagin (126 million RUB per year) |
| 4 | BC Khimki Khimki (Moscow region) |
227,3 | 1676,0 | 811,1 | 1903,3 | Alexei Shved (189 million RUB per year) |
| 5 | BC Zenit Saint Petersburg |
115,6 | 854,7 | 437,6 | 970,3 | Sergey Karasev (94,5 million RUB per year) |
| 6 | BC Parma Perm Perm |
39,0 | 217,9 | 44,0 | 256,9 | Rashard Kelly (4,4 million RUB per year *) |
| 7 | BC Yenisei Krasnpyarsk |
15,9 | 269,7 | 192,4 | 285,6 | D'Angelo Harrison (12,8 million RUB per year *) |
| 8 | BC Avtodor Saratov |
9,8 | 169,7 | 120,3 | 179,5 | Perrin Buford (8 million RUB per year *) |
| 9 | BSK Samara Samara |
9,6 | - | - | 9,6 | Vladimir Pichkurov (data is not disclosed) |
| 10 | BC Nizhniy Novgorod Nizhniy Novgorod |
Data not disclosed | 424,4 | 135,0 | 424,4 | Vladimir Dragichevich (9,6 million RUB per year *) |
PBC CSKA with the highest balance sheet assets (800 million rubles) and the budget (2,7 billion RUB) is the first in the ranking. CSKA is the most titled club in the history of domestic and world basketball: it won trophies in championships of the USSR-era, as well as Russian and European ones.
In Russia, PBC CSKA is the absolute champion and the second to no one:
- 10 out of 11 times became the winner of the VTB United League;
- 26 out of 28 became the champion of Russia;
- 24-time USSR champion;
- 8-time Euroleague winner4
CSKA Basketball Club has the strongest and most valuable team in the entire league. However, at the end of the season 2018/19, having won another victory in the Euroleague and in the domestic championship, a number of leaders left the team. In the season 2019/2020, the reshaped team will play.
The second is BC UNICS from Kazan. The volume of the balance sheet assets of the club is almost 2,5 times less than the sum of balance assets (359,9 million RUB) than of the Top leader. The team from Tatarstan is inferior to Moscow not only by the sum of balance sheet assets, but also by all other indicators. Throughout the history of BC UNICS, the club have never become the Champion of Russia and the winner of the VTB United League: 8 times it has been a step from the championship, and 11 times took the third place. However, the Kazan club has an international trophy: in the season 2010/11 the team won the European Cup5. The most valuable player of BC UNICS is Jamar Smith (40 million RUB per year). The American played in many European clubs, has a large number of individual awards and achievements based on the results of his performance in the VTB United League.
PBC Lokomotiv-Kuban is ranked the third. Like the BC UNICS team, Lokomotiv-Kuban has never won domestic championships: once it won the second place and 5 times - the third. But in the season 2012/13, the Krasnodar team won an international trophy - the European Cup. In terms of the budget for the season, the club from Krasnodar has almost no equal (1,1 billion RUB). The most valuable player is Dmitry Kulagin (126 million RUB per year), a multiple champion in other teams, the winner of the Euroleague in the season 2015/16 in the PBC CSKA.
BC Khimki in the season 2010/11 became the champion of the VTB United League, which allowed the club to be ranked the second team in in terms of trophies. Russia. In addition, the club is a two-time winner of the European Cup and won the second place in the Russian championships for 16 times. The most valuable player of the team is Alexei Shved (189 million RUB per year). The Russian played in the NBA6for 3 seasons. He is the multiple winner of the Russian championships, Honored Master of Sports of Russia, winner of the Euroleague, bronze medalist of the Olympic Games in London (2012) and European Championship (2011), and the member of the NBA rising stars competition (2013).
The fifth is the club from St. Petersburg. BC Zenit was formed in 2014. Over the five years of its existence, the team has achieved quite good results: 3-time bronze medalist of the VTB United League, regular participant in the play-offs, finalist of the Russian Basketball Championship. The most valuable player in the team is Sergey Karasev (94,5 million RUB per year). He played in the NBA for 3 seasons and helped the Russian team win bronze medals at the Olympic Games in London (2012).
The balance sheet assets of basketball clubs from the second part of the table do not exceed the total balance sheet assets of the team from Saint Petersburg. BC Parma, BC Yenisei, BC Avtodor, BSK Samara and BC Nizhniy Novgorod did not achieve success in the Russian championship, and performances in the play-offs often ended in the first stage. Such unsatisfactory results can be explained by the lack of funding: major sponsors do not invest in the development of regional clubs, as there is a risk not to make a profit.
It is noteworthy that BSK Samara is not a member of the VTB United League. The club seeks to get into it, therefore there is no data on the budget. As soon as the Samara team expands the capacity of its basketball court to 3 thousand people, the management of the VTB United League will satisfy the request to join the top division.
Unlike football and hockey, 7 basketball teams from the Top-10 are privately owned. The owners of BC Khimki, PBC Lokomotiv-Kuban, BC UNICS, BSK Samara, BC Nizhniy Novgorod, BC Parma and BC Avtodor are individuals. They own clubs directly or through various commercial funds. The largest private metallurgical company of Russia - JSC MMC Norilsk Nickel can be considered as the main private beneficiary of PSC CSKA.
The ultimate owners of the team from Saint Petersburg are the state structures owning the basketball team through the largest corporation. BC Zenit is controlled by the Russian government through JSC Gazprom.
BC Yenisei is a non-profit organization.
The results of the ranking showed that teams with good funding are making progress in basketball. The greater the budget of the club for the season, the greater success awaits them. The first 5 teams from the Top have a serious financial support from the sponsors, and the rest of the teams have to manage with their own funds, so it is impossible to achieve great results at this level of competition.
1 FIBA is the organization uniting all national basketball federations and defining the main directions of the world basketball development.
2 Play-off - a series of elimination games (up to 3 wins).
3 * Contract details are not disclosed; the contract value is calculated approximately based on the total amount of the salary project and the number of players.
4 European basketball tournament among professional men's clubs from member countries of FIBA Europe.
5 The European Cup is the second-largest European basketball tournament among professional men's basketball clubs after Euroleague
6 NBA - National Basketball Association, men's professional basketball league of North America, the most famous and popular basketball world league