Notification procedure for assembling and exploitation of elevators and escalators
Amendments to the Federal Law № 294-FL «On protecting rights of legal entities and individual entrepreneurs during the execution of the public control (supervision) and municipal control» were made by the Federal Law of April 23, 2018 № 94-FL.
According to the Amendments, during 6 months after September 1, 2018 legal entities and individual entrepreneurs, involved in assembling, exploitation and repair of elevators, platforms for the disabled, moving sideways and escalators, are obliged to inform the authorized federal executive body about carrying out these activities. This regulation is not applicable to activities involving subways escalators.
Notifications should be sent according to the order defined by the Federal Law № 294- FL of 26.12.2008.
According to the Russian Classification of Economic Activities, operating since February 1, 2014 (OKVED2), these activity types can be defined by the following codes:
28.22 Manufacture of lifting and transporting equipment, including
28.22.6 Manufacture of elevators, skip winders, escalators and moving sideways;
43.29 Other construction and assembling works, including installation or assembling of elevators and escalators in the buildings, their repair and maintenance.
According to the Information and Analytical system Globas currently more than 21 thousands of legal entities and individual entrepreneurs are carrying out these activities as main ones.
Solvency ratio of the largest Russian meat products manufacturers
Information agency Credinform has prepared a ranking of the largest Russian manufacturers of packaging. The companies with the largest volume of annual revenue (TOP-10) have been selected for the ranking, according to the data from the Statistical Register for the latest available accounting periods (2014 — 2016). Then they have been ranked by solvency ratio (Table 1). The analysis was based on the data from the Information and Analytical system Globas.
Solvency ratio (x) is a ratio of shareholders’ equity to total assets and shows the dependence of the company on external loans. Its recommended value: >0,5. A value less than a minimum one is indicative of a dependence on external sources of funds, which may result in a liquidity crisis, unstable financial standing in the event of economic downturn.
A calculation of practical values of financial ratios, which might be considered as normal for a certain industry, has been developed and implemented in the Information and Analytical system Globas by the experts of the Information Agency Credinform, having taken into account the current situation in the economy as a whole and in the industries.
The practical value of solvency ratio of meat products manufacturers amounted from 0,01 to 0,85 in 2016.
The whole set of indicators and financial ratios is to be considered in order to get a full and comprehensive insight into a company’s financial standing.
| Name, INN, region | Revenue, million RUB | Net profit, million RUB | Solvency ratio (x) | Solvency index Globas | |||
| 2015 | 2016 | 2015 | 2016 | 2015 | 2016 | ||
| 1 | 2 | 3 | 4 | 5 | 6 | 7 | 8 |
| Ostankinsky Meat-Processing Plant PJSC INN 7715034360 Moscow |
36 764 |  39 569 39 569 |
812 |  928 928 |
0,85 |  0,93 0,93 |
216 Strong |
| ITERA NJSC INN 4003037662 Kaluga region |
9 619 |  11 171 11 171 |
485 |  803 803 |
0,77 |  0,87 0,87 |
208 Strong |
| Mikoyanovsky Meat Factory NJSC INN 7722169626 Moscow |
12 301 |  12 454 12 454 |
135 |  155 155 |
0,40 |  0,46 0,46 |
173 High |
| Starodvorskie sausages NJSC INN 3328426780 Vladimir region |
15 197 |  16 507 16 507 |
644 |  307 307 |
0,25 | 0,25 | 231 Strong |
| Atyashevsky Meat Processing Plant LLC INN 1303066789 Republic of Mordovia |
11 503 |  12 556 12 556 |
149 |  250 250 |
0,14 |  0,16 0,16 |
214 Strong |
| Poultry Factory LLC INN 2631029799 Stavropol territory |
11 733 |  11 613 11 613 |
69 |  95 95 |
0,09 |  0,10 0,10 |
242 Strong |
| Agro-Belogorie Meat Processing Plant LLC INN 3123183960 Belgorod region |
17 480 |  15 675 15 675 |
-11 |  55 55 |
0,01 |  0,02 0,02 |
248 Strong |
| Belaya Ptica-Kursk LLC INN 4604006115 Kursk region |
10 696 |  11 424 11 424 |
-27 |  29 29 |
0,00 |  0,01 0,01 |
276 Medium |
| Cherkizovsky Meat Processing Plant NJSC INN 7718013714 Moscow |
29 953 |  32 430 32 430 |
-881 |  -1 759 -1 759 |
0,10 |  -0,08 -0,08 |
288 Medium |
| Velikoluksky Meat Plant PJSC INN 6025009824 Pskov region |
15 737 |  17 250 17 250 |
-1 105 |  807 807 |
-0,36 |  -0,29 -0,29 |
240 Strong |
| Total for TOP-10 companies | 172 998 |  182 665 182 665 |
2 285 |  3 686 3 686 |
|||
| Average value for TOP-10 companies | 17 300 |  18 267 18 267 |
229 |  369 369 |
0,23 |  0,24 0,24 |
|
| Average industry value | 205 |  211 211 |
2 | 2 | 0,14 |  0,21 0,21 |
|
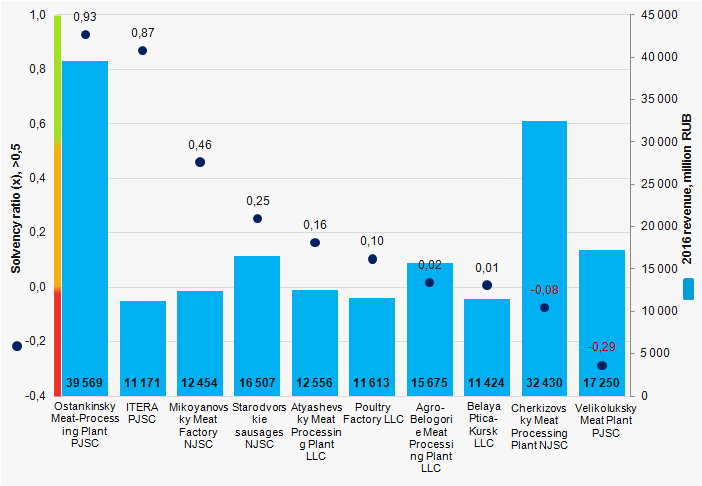
Average value of solvency ratio for TOP-10 companies is above the recommended values. Two of TOP-10 companies a solvency ratio above the recommended, and two companies have a negative ratio value.
 Picture 1. Solvency ratio and revenue of the largest Russian meat products manufacturers (TOP-10)
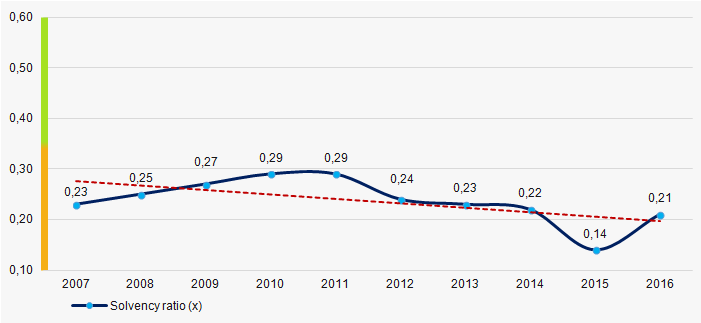
Average industry values of solvency ratio tend to decrease within the last decrease (Picture 2). This is indicative of a high dependence of meat processing industry on external loans.
 Picture 2. Change in average industry values of solvency ratio of the largest Russian manufacturers of meat products in 2007 — 2016