
Order a report
Custom-made industry research, company ratings, competitor analysis


Assets turnover of the largest Russian bakery and confection producers
Information agency Credinform prepared a ranking of the largest Russian bakery and confection producers. Companies with the highest volume of revenue (TOP-10) were selected for this ranking according to the data from the Statistical Register for the latest available periods (2016 and 2015). The enterprises were ranked by assets turnover ratio (Table 1). The analysis was based on data from the Information and Analytical system Globas.
Assets turnover is sales revenue to the average total assets for the period. This indicator is included in the group of activity ratios and shows the efficiency of all available resources despite of their source. The ratio indicates the number of profitable full cycles of production and turnover per year.
Taking into account the actual situation both in economy in general and in the sector, the experts of the Information agency Credinform have developed and implemented in the Information and Analytical system Globas the calculation of practical values of financial ratios, which can be recognized as normal for a particular industry. The practical value of assets turnover ratio for bakery and confection producers in 2016 is from 1,79 and from 1,38 times respectively.
For the most complete and objective view of the financial condition of the enterprise it is necessary to pay attention to the complex indicators and financial ratios of the company.
| Name, INN, region | Revenue, mln RUB | Net profit, mln RUB | Assets turnover ratio, times | Solvency index Globas | |||
| 2015 | 2016 | 2015 | 2016 | 2015 | 2016 | ||
| 1 | 2 | 3 | 4 | 5 | 6 | 7 | 8 |
| LLC FAZER INN 7810356819 Saint-Petersburg Production of bread and pastry |
10 154 | 18 57 | -300 | 812 | 1,77 | 3,11 | 175 Superior |
| JSC KARAVAY INN 7830000360 Saint-Petersburg Production of bread and pastry |
8 600 | 8 947 | 98 | -138 | 3,04 | 2,96 | 221 Strong |
| LLC KELLOGG RUS INN 3661048688 Voronezh region Production of rusks, cookies and other rusk bakery products; pastry, cakes, biscuits, pies and sponge-cakes of long shelf life |
8 291 | 10 471 | -1 394 | -169 | 2,23 | 2,57 | 273 Medium |
| JSC KHLEBPROM INN 7448027569 Chelyabinsk region Production of rusks, cookies and other rusk bakery products; pastry, cakes, biscuits, pies and sponge-cakes of long shelf life |
10 049 | 11 498 | 108 | 384 | 2,06 | 2,37 | 201 Strong |
| LLC MON'DELEZ RUS INN 3321020710 Vladimir region Production of chocolate and sugary confection |
58 590 | 56 862 | 576 | 1 152 | 2,13 | 2,31 | 232 Strong |
| JSC FERRERO RUSSIA INN 5044018861 Vladimir region Production of chocolate and sugary confection |
33 623 | 38 418 | 2 839 | 4 300 | 1,63 | 1,75 | 146 Superior |
| LLC BARRY CALLEBAUT NL RUSSIA INN 5048014441 Moscow region Production of cocoa, chocolate and sugary confection |
6 437 | 6 952 | 1 012 | 908 | 1,83 | 1,55 | 176 High |
| LLC MARS INN 5045016560 Moscow region Production of chocolate and sugary confection |
93 951 | 102 581 | 14 669 | 16 717 | 1,03 | 1,02 | 190 High |
| LLC KDV YASHKINO INN 4246006730 Kemerovo region Production of rusks, cookies and other rusk bakery products; pastry, cakes, biscuits, pies and sponge-cakes of long shelf life |
9 698 | 10 089 | 159 | 30 | 1,00 | 0,90 | 253 Medium |
| PJSC BABAEVSKY CONFECTIONERY CONCERN INN 7708029391 Moscow Production of chocolate and sugary confection |
9 853 | 9 535 | 719 | 245 | 0,68 | 0,67 | 200 Strong |
| Total for TOP-10 | 249 247 | 273 609 | 18 485 | 24 242 | |||
| Average value for TOP-10 companies | 24 925 | 27 361 | 1 849 | 2 424 | 1,74 | 1,92 | |
| Average value for confectionery production | 846 | 881 | 47 | 52 | 1,31 | 1,38 | |
| Average value for bakery production | 75 | 78 | 1 | 2 | 1,80 | 1,79 | |
Average value of assets turnover ratio for TOP-10 is above the industry average. Compared to the previous period, two companies in TOP-10 have increased revenue and net profit figures (marked with green in columns 2 — 5 of Table 1). The rest of companies decreased revenue or net profit, or have losses (filled with red in columns 2 — 5 of Table 1).
 Picture 1. Assets turnover and revenue of the largest Russian bakery and confection producers (TOP-10)
The average industry indicators of assets turnover ratio over the past 10 years have a trend to decrease (Picture 2).
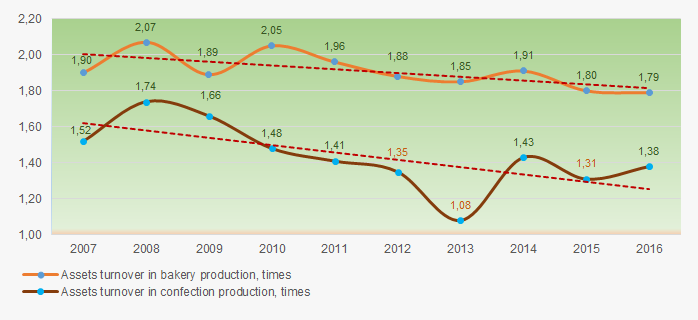 Picture 2. Change in average industry values of assets turnover ratio of the largest Russian bakery and confection producers in 2007 — 2016