Ranking
Solvency ratio of the largest Russian enterprises, mining precious and non-ferrous metal ores

Information agency Credinform prepared a ranking of the largest Russian enterprises, mining precious and non-ferrous metal ores.

The enterprises, mining precious and non-ferrous metal ores, with the highest volume of revenue (TOP-10) were selected for the ranking, according to the data from the Statistical Register for the latest available accounting period (for the year 2015). Then the companies were ranked by decrease in solvency ratio (Table 1).

Solvency ratio (х) is calculated as a relation of equity capital to total assets and characterizes the company's dependence on external loans. Recommended value of the ratio is: > 0,5.

The ratio value below the minimum recommended limit means a high dependence on external sources of financing. By the worsening of conjecture in the market it may lead to liquidity crisis and to unstable financial position.

For getting of the most comprehensive and fair picture of the financial standing of an enterprise it is necessary to pay attention to all available combination of ratios, financial and other indicators.

Table 1. Net profit, revenue, solvency ratio and solvency index Globas-i of the largest enterprises, mining precious and non-ferrous metal ores (TOP-10)
Name, INN, regionNet profit for 2015, in mln RUBRevenue for 2015, in mln RUBRevenue for 2015 by 2014, %Solvency ratio, (х)Solvency index Globas-i
GOLD OF NOTHERN URALS JOINT STOCK COMPANY
INN 6617001534 Sverdlovsk region
5 660,0 10 140,6 90 0,97 208
High
JOINT STOCK COMPANY SEREBRO MAGADANA
INN 4900003918 Magadan region
11 294,4 26 627,8 142 0,90 219
High
LIMITED COMPANY NOVOANGARSKY DRESSING PLANT
INN 2426003607 Krasnoyarsk territory
5 250,6 13 906,6 112 0,85 162
The highest
UCHALINSKY GOCK
INN 0270007455 Republic of Bashkortostan
3 300,7 24 151,9 127 0,76 204
High
CLOSED CORPORATION CHUKOTKA MINING GEOLOGICAL COMPANY
INN 8709009294 Chukotka Autonomous Region
10 214,7 32 335,5 87 0,66 189
The highest
JOINT-STOCK COMPANY GOLD-MINING COMPANY POLUS
INN 2434000335 Krasnoyarsk territory
37 827,5 91 691,6 152 0,53 183
The highest
JOINT STOCK COMPANY GAI MINING AND PROCESSING CO JSC
INN 5604000700 Orenburg region
2 185,1 24 511,0 141 0,51 228
High
LIMITED LIABILITY COMPANY NORTHERN GOLD
INN 8706005044 Chukotka Autonomous Region
11 227,1 24 707,0 191 0,51 246
High
ALBAZINO RESOURCES LTD
INN 2721128498 Khabarovsk territory
4 163,4 15 724,1 136 0,42 247
High
JSC Sevuralboksitruda
INN 6631001159 Sverdlovsk region
5 618,0 76 472,8 200 0,30 263
High

The average value of the solvency ratio in the group of TOP-10 largest enterprises, mining precious and non-ferrous metal ores, was 0,64 in 2015 against 0,60 in 2014. The same index in the group of TOP-100 companies made 0,42 in 2014, by industry average value of 0,48.

Recline in solvency ratio in 2015 compared with the previous year is observed by UCHALINSKY GOCK, JOINT-STOCK COMPANY GOLD-MINING COMPANY POLUS and JOINT STOCK COMPANY GAI MINING AND PROCESSING CO JSC.

ALBAZINO RESOURCES LTD and JSC Sevuralboksitruda did not meet the recommended standard of the ratio as well in 2014 as in 2015. By this the second company showed the maximum growth in revenue in 2015 in regard to 2014 in the group of TOP-10 companies. The decrease in revenue for this period was by GOLD OF NOTHERN URALS JOINT STOCK COMPANY and CLOSED CORPORATION CHUKOTKA MINING GEOLOGICAL COMPANY.

Though, on the combination of financial and non-financial indicators, all enterprises got the highest or high solvency index Globas-i, that indicates their ability to repay their debts in time and fully.

Solvency ratio and revenue of the largest enterprises, mining precious and non-ferrous metal ores (TOP-10)
Picture 1. Solvency ratio and revenue of the largest enterprises, mining precious and non-ferrous metal ores (TOP-10)

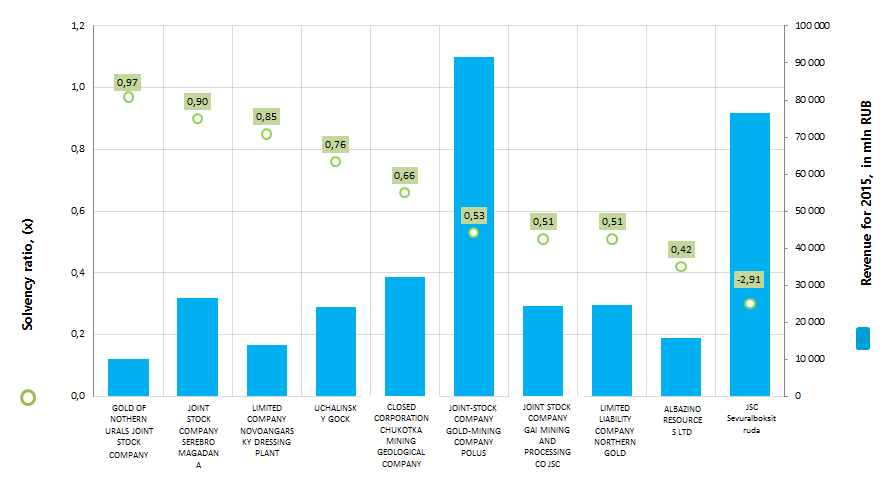
The total revenue of the TOP-10 companies reached 340,3 billion rubles in 2015, that is by 42% more than in 2014. At the same time the total net income in 2014 and in 2015 increased more than twice in relation to the corresponding previous periods.

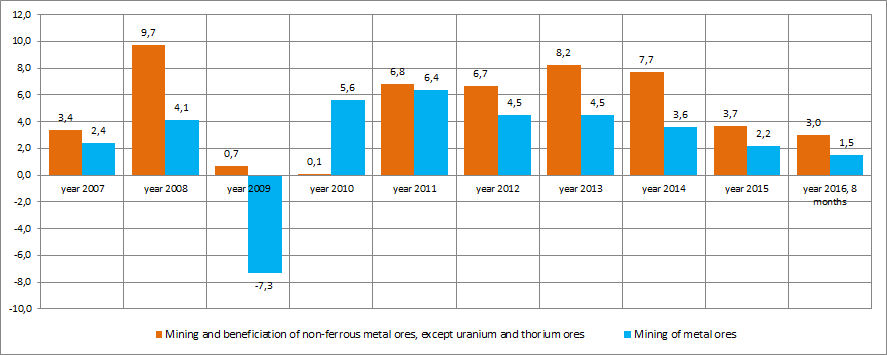
In general, the enterprises of TOP-10 and TOP-100 groups demonstrate a high enough independence on external sources of funds. However, the discernible trend to a decrease in the level of production is observed in this industry recently. This is as evidenced by the data of the Federal State Statistics Service (Rosstat) (Picture 2).

The index of production (the period from the beginning of the year, an increase / decrease in % to the corresponding period of the previous year)
Picture 2. The index of production (the period from the beginning of the year, an increase / decrease in % to the corresponding period of the previous year)

The enterprises, mining precious and non-ferrous metal ores, are distributed across country's regions unequal and biased to the corresponding mineral fields. Thus, according to the data of the Information and analytical system Globas-i, 100 the largest companies on the volume of revenue for 2014 are registered in 22 regions. The greatest number of them is registered in the regions shown in Table 2.

Table 2. TOP-10 regions, where the majority of enterprises is registered, mining precious and non-ferrous metal ores.
RegionNumber of companies
Republic of Sakha (Yakutia) 13
Magadan region 11
Irkutsk region 10
Krasnoyarsk territory 9
Khabarovsk territory 8
Chukotka Autonomous Region 7
Amur region 6
Sverdlovsk Region 6
Kamchatka territory 4
Republic of Bashkortostan 4

Thus, 78% of the largest companies of this industry are concentrated in 10 regions of the country.

Herald
Most of the Russian companies continue to make profit

Despite of negative external climate and complicated economic situation, business in Russia continues to make profit for owners and shareholders. This statement is reasonable for companies operating in various sectors of industry and services. Following the results of the first half-year of 2016, 69% of companies in Russia made net profit. In comparison with the I half-year of 2015, the increase in profit-making companies is 0,4 percentage points (p.p.).

Totally for 2015, the number of profit- and loss-making companies, compared to 2014, stays at the same level – 71,9% and 28,1% relatively. It should be noticed, that the number of companies with positive results is, as a rule, higher for the whole financial year than for the I half-year. In view of this, it is reasonable to speak about keeping or even some enhancement of business efficiency.

As a comparison: the number of profit-making companies in 2003 was at the lower level than today – 57% (see picture 1). This indirectly indicates the higher vulnerability of the Russian economy even some years back, when there was no serious geopolitical confrontation with the Occident, sanction pressure and overt discrimination of the Russian business and the country in general. Being stronger today, Russia gives an opportunity for several millions of companies not only to stay in the course, but to make net profit.

Share of profit- and loss-making companies in Russia of total number of companies, %Picture 1. Share of profit- and loss-making companies in Russia of total number of companies, %

For an understanding where the company accumulates profit or loss, it is necessary to take a sectoral look at the economy.

According to the analyses, prosperous companies are concentrated in various sectors of the economy and there is no field-specific distribution of profit- or loss-making business: wholesale (excluding sale of motor vehicles), pulp and paper production, agriculture, chemical industry are the sectors with the overwhelming number of profit-making companies.

For the examined period (first half-year of 2016 to the first half-year of 2015) the increase in the number of profit-making companies in the pulp and paper sector amounted to 6,2 p.p. (see table 1), but the sector of transportation by pipeline lost profitable companies (-4,5 p.p.). Wholesale companies (-0,5 p.p.), the companies for production and distribution of fluid fuel (-1,1 p.p.) also sustain losses. Crisis in supplies of energy to the Ukraine and consumer resistance make clear the process of reduction of the number of profit-making companies in the mentioned sectors.

Table 1. Share of pofit-making companies by sectors of the economy for the first half-year of 2016, Top-10 of sectors
Sector Share of profit-making companies, % Increase/decrease in the share of profit-making companies compared to the I half-year of 2015, percentage points
1 Wholesale (excluding sale of motor vehicles) 83,1 -0,5
2 Production of pulp, paper, cardboard 82,9 6,2
3 Agriculture 82,8 0,5
4 Chemical production 82,1 2,2
5 Transportation by pipeline 81,7 -4,5
6 Production of leather and goods thereof 81,5 2,9
7 Fishery 80,9 0,7
8 Production of food products, beverages and tobacco 80,0 0,6
9 Production of rubber and plastic goods 79,1 4,7
10 Production and distribution of fluid fuel 78,7 -1,1
  Total for the economy 69,2 0,4

At the other side, following the results of the I half-year of 2016, 30,8% of total number of companies in Russia sustained losses (see picture 2). But this indicator is lower than in the relevant period of 2015, when 31,2% of loss-making companies were recorded.

Comparing the actual data for 2015 with the indicator in 2003, the positive trend is observed: the number of loss-making companies for the past 12 years reduced from 43% to 28,1% or by 14,9 p.p. Recently, either of the four companies in the country haven’t made profit.

The largest share of loss-making companies is observed in transport and in housing and communal services, as well as in services for population (hotels, cafes, restaurants, tourism). These sectors are traditionally supported by the state and decrease in demand directly indicates decrease in real income of the population (see table 2).

Table 2. Share of loss-making companies by sectors of the economy for the first half-year of 2016, Top-10 of sectors
Sector Share of loss-making companies, % Increase/decrease in the share of loss -making companies compared to the I half-year of 2015, percentage points
1 Activity of other land transport, except railroad 51,6 -3,1
2 Extraction of mineral resources, except fuel and energy 47,1 -2,4
3 Production and distribution of gas, steam and hot water 46,4 -1,6
4 Production of other non-metallic mineral products 42,5 7,9
5 Housing stock management 41,2 -0,3
6 Recreational, tourism, culture and sports activity 40,3 -2,5
7 Hotels and restaurants 37,3 -3,2
8 Printing and publishing 36,8 -4,4
9 Production of vehicles and equipment 34,3 -2,9
10 Research and development 33,0 4,5
  Total for the economy 30,8 -0,4

The forming way of the economic development for potential investors is an evidence of stability of the Russian economy even under the negative external climate. The situation is not as catastrophic as it is covered, especially in the foreign publications. Handling the quite wide-spread and overworked ideas on crucial role of resourcing rent in the development of Russia, the part of the western political establishment and leading economists set their minds on the beginning of breakdown and fast close of business. However, a large part of the EU and even the USA business community understand the absurdity of an obvious fact denial – it is worth to work in Russia, there is a possibility to make profit in the sectors not related to oil and gas extraction. Here are some sustaining examples:

  • After almost a century, last year Russia took back the status of the leading grain (including wheat) supplier to the world market (30,7 mln tons in 2015) and left acknowledge leaders – Canada, the USA and France – behind. Probably this year Russia will achieve a historic record in gross grain harvesting for the whole post-Soviet period: agrarians expect harvest of about 120 mln tons (110,4 mln tons of grain were harvested as of September 28, 2016);
  • National weapon is in higher demand in many countries not included in NATO. For already several years Russia has been taking a second position after the USA by a scale of supplies;
  • Following the results of 2015, economy of the Russian Internet (content and services) amounted to 1 355,38 bln RUB and 588 bln RUB – to the volume of the electronic payment market, that is totally an equivalent to 2,4% of the GDP of Russia. In monetary terms, so called “Internet-dependent markets” are equitable to 19% of the GDP of Russia. Contrary to traditional manufacturing, this sector is on the fast track. Representatives of the IT-industry, famous for their brands “Yandex”, “Kaspersky Lab”, “1C”, “Lanit” entered the international arena;
  • “Uralkali” company is the largest manufacturer of potassium fertilizers in the world;
  • “Corporation ROSATOM” implements the energetic projects of immense complexity for the creation of the nuclear industry in Iran and Turkey from the ground.

Taking into account all drawbacks, Russia created diversified economy; there is a potential (deferred by various crises) to further development and profit-making.