Systemically important credit institutions
The Central Bank of the RF approved the list of systemically important credit institutions, whose share in the total assets of the country's banking sector is more than 60%.
The methodology for classifying of banks as systemically significant is determined by the Order №3737-U of the Central Bank of the RF dated 22.07.2015 and includes quantitative indicators of activity, international activity criteria, and other information about credit institutions.
Quantitative indicators include the following:
- assets;
- invested assets;
- borrowings;
- volume of deposits of individuals;
- summarizing result.
Internationally active banks include:
- parent credit institutions of banking groups, which share of assets of participants registered in the territory of a foreign state exceeds 10% of the total assets of the banking group;
- credit institutions, in which the total amount of funds raised from non-residents exceeds 100 billion rubles;
- credit organizations that are part of a banking group or holding, which parent organization is a non-resident of the RF and calculates the short-term liquidity ratio in accordance with the prudential regime (i.e. guaranteeing stability and safeguarding interests), being in force in the country where the parent organization is located.
Other information on credit institutions, in accordance with Appendix 3 to the Order №3737-U of the Central Bank of the RF, includes 10 indicators, characterizing the degree of influence of the parent organization on the activities of a banking group or holding.
The list of systemically important credit institutions is approved annually by the Chairman of the Central Bank of the RF as advised by the Banking Supervision Committee. In 2019, the list includes 11 banks:
UNICREDIT BANK NJSC , GAZPROMBANK NJSC, BANK VTB PJSC, ALFA-BANK NJSC , SBERBANK OF RUSSIA PJSC, CREDIT BANK OF MOSCOW PJSC, BANK OTKRITIE FINANCIAL CORPORATION PJSC, ROSBANK PJSC , PROMSVYAZBANK PJSC, RAIFFEISENBANK NJSC, RUSSIAN AGRICULTURAL BANK NJSC .
Subscribers of the Information and Analytical system Globas have the opportunity to get acquainted with the activity of all banking and non-bank credit organizations, as well as their branches with existing and revoked licenses. In total, Globas contains more than 6 700 banks and about 150 thousand organizations, whose activity is regulated by the Central Bank of the RF.
Activity trends of children's recreation camps
Information agency Credinform has prepared a review of trends of the largest children’s recreation camps.
The largest camps (TOP-100) in terms of annual revenue were selected for the analysis according to the data from the Statistical Register for the latest available periods (2013-2018). The analysis was based on the data of the Information and Analytical system Globas.
Net assets are total assets less total liabilities. This indicator reflects the real value of the property of an enterprise. When the company’s debt exceeds the value of its property, the indicator is considered negative (insufficiency of property).
The largest camp in term of net assets is LLC Children's recreation camp named after A.V. Kazakevich, INN 9104000322, the Republic of Crimea. In 2018, net assets value of the company exceeded 106 million RUB.
The lowest net assets volume among TOP-100 belonged to LLC Children's recreation camp ORLYENOK-YUG, INN 9101006904, the Republic of Crimea. In 2018, insufficiency of property of the company was indicated in negative value of -38 million RUB.
Covering the five-year period, the average net assets values have a trend to increase (Picture 1).
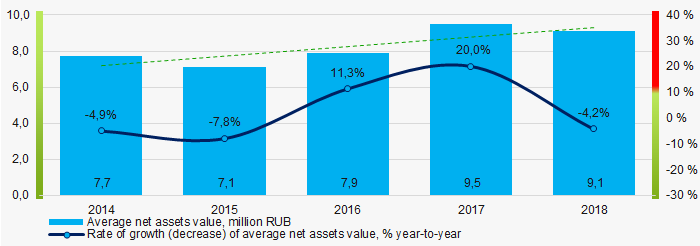 Picture 1. Change in average net assets value in 2014 – 2018
The shares of TOP-100 companies with insufficient property have trend to increase over the past five years (Picture 2).
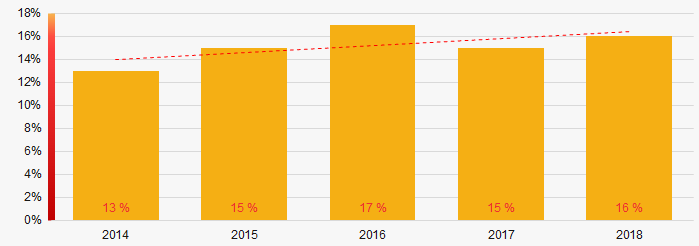 Picture 2. Shares of companies with negative net assets value in TOP-100
Sales revenue
LLC Children's recreation camp Morskaya volna, INN 2365013436, Krasnodar territory, is at the head of TOP-100 by revenue, which was amounted to 304 million RUB in 2018.
In general, there is a trend to increase in revenue (Picture 3).
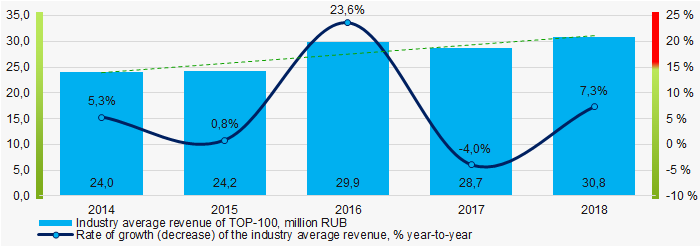 Picture 3. Change in industry average net profit in 2014-2018
Profit and loss
КThe largest company in term of net profit is LLC Sports and recreation camp Detskiy gorodok Salyut, INN 5075029454, Moscow region. The company’s profit for 2018 amounted to 41 million RUB.
Over the five-year period, there is a trend to increase in average net profit (Picture 4).
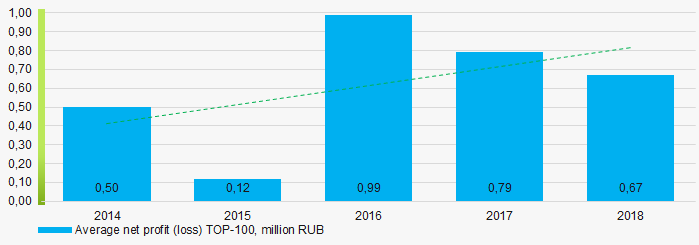 Picture 4. Change in industry average net profit (loss ) values in 2014-2018
For the five-year period, the average net profit values of TOP-100 companies increase with the average net loss value also having the increasing trend (Picture 5).
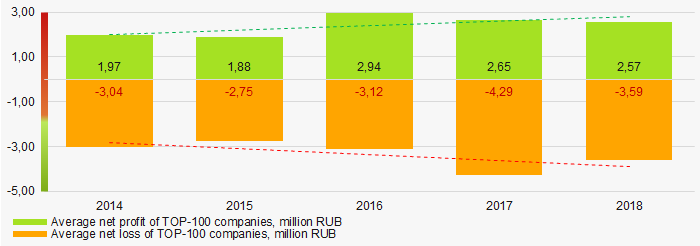 Picture 5. Change in average net profit and net loss of ТОP-100 in 2014 – 2018
Key financial ratios
For the five-year period, the average values of the current liquidity ratio were significantly above the recommended one - from 1,0 to 2,0 with a trend to decrease (Picture 6).
Current liquidity ratio (current assets to short-term liabilities) shows the sufficiency of company’s assets to repay on short-term liabilities.
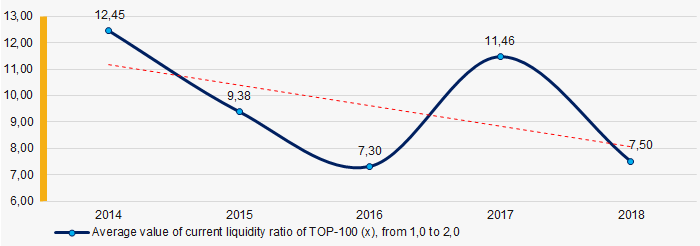 Picture 6. Change in industry average values of current liquidity ratio in 2014 – 2018
For the five-year period, the average values of ROI ratio have a trend to decrease (Picture 7).
ROI ratio is calculated as net profit to sum of shareholders equity and long-term liabilities, and shows the return of equity involved in commercial activities and long-term borrowed funds.
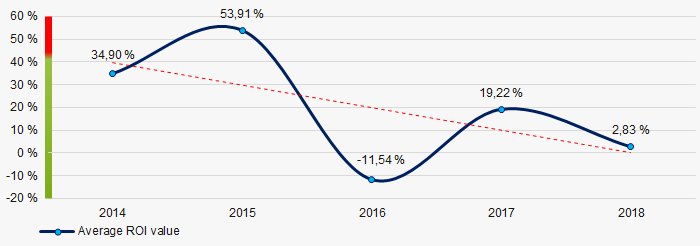 Picture 7. Change in average values of ROI ratio in 2014 – 2018
Assets turnover ratio is the ratio of sales revenue and company’s average total assets for a period. It characterizes the effectiveness of using of all available resources, regardless the source of their attraction. The ratio shows how many times per year the full cycle of production and circulation is performed, generating the corresponding effect in the form of profit.
For the five-year period, business activity ratio demonstrated the increasing trend (Picture 8).
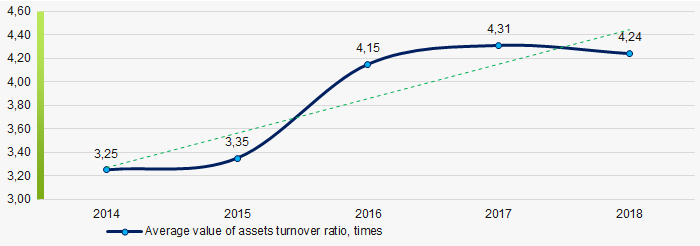 Picture 8. Change in average values of assets turnover ratio in 2014 – 2018
Small business
67% companies of TOP-100 are registered in the Register of small and medium-sized enterprises of the Federal Tax Service of the Russian Federation. At the same time, their share in total revenue of TOP-100 companies amounted to 81% that is significantly higher than the national average figure (Picture 9).
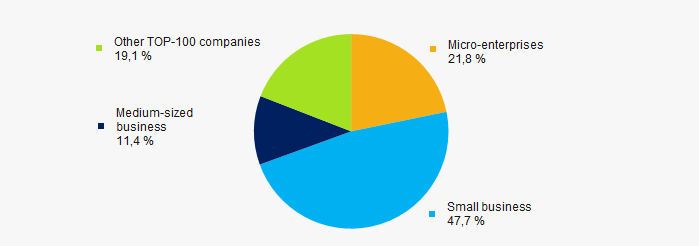 Picture 9. Shares of small and medium-sized enterprises in TOP-100
Main regions of activity
Companies of TOP-100 are registered in 36 regions of Russia, and unequally located across the country. taking into account the specifics of activity Over 26% of companies largest by revenue are located in Krasnodar territory (Picture 10).
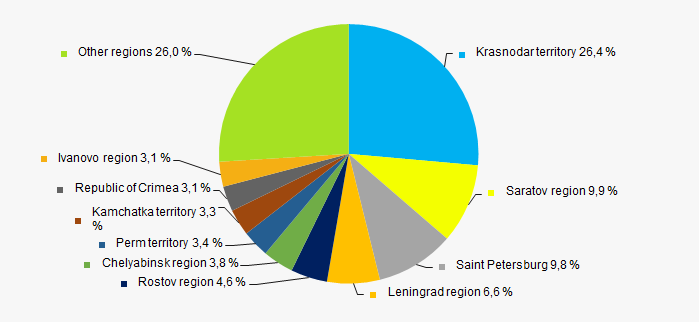 Picture 10. Distribution of TOP-100 revenue by regions of Russia
Financial position score
Assessment of the financial position of TOP-100 companies shows that the majority of them have average financial position (Picture 11).
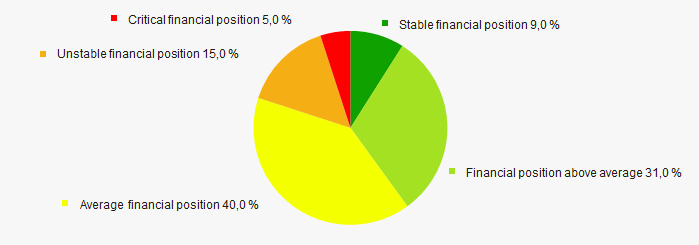 Picture 11. Distribution of TOP-100 companies by financial position score
Solvency index Globas
Most of TOP-100 companies got Superior / High and Strong / Medium index Globas. This fact shows their ability to meet their obligations fully (Picture 12).
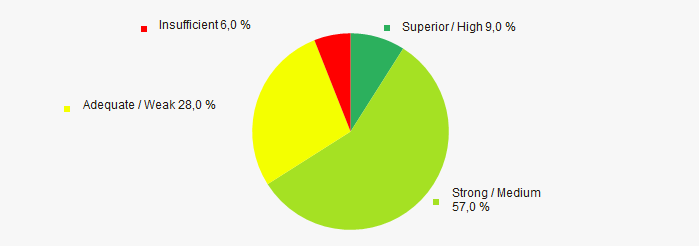 Picture 12. Distribution of TOP-100 companies by solvency index Globas
Conclusion
Complex assessment of activity of the largest children’s recreation camps, taking into account the main indexes, financial ratios and indicators, demonstrates the prevalence of positive trends (Table 1).
| Trends and evaluation factors | Relative share of factors, % |
| Rate of growth (decline) in the average size of net assets |  10 10 |
| Increase / decrease in the share of enterprises with negative values of net assets |  -10 -10 |
| Rate of growth (decline) in the average size of revenue |  10 10 |
| Rate of growth (decline) in the average size of profit (loss) |  10 10 |
| Growth / decline in average values of companies’ net profit |  10 10 |
| Growth / decline in average values of companies’ net loss |  -10 -10 |
| Increase / decrease in average values of total liquidity ratio |  -5 -5 |
| Increase / decrease in average values of return on investment ratio |  -10 -10 |
| Increase / decrease in average values of asset turnover ratio, times |  10 10 |
| Share of small and medium-sized businesses in the region in terms of revenue being more than 22% |  10 10 |
| Regional concentration |  -5 -5 |
| Financial position (the largest share) |  5 5 |
| Solvency index Globas (the largest share) |  10 10 |
| Average value of relative share of factors |  2,7 2,7 |
 positive trend (factor),
  negative trend (factor).