
Order a report
Custom-made industry research, company ratings, competitor analysis


TOP 1000 of freight transport companies
In 2021, due to the shortage of sea vessels and containers, difficulties arose in the movement of goods from China to Europe. Part of the freight traffic switched to road transport, which led to an increase in the cost of transportation from Primorye to the European part of Russia. The results of 2021 will later show how much this situation could affect the situation in the industry in general, while the positive development trends were observed in the period 2011 – 2020.
Among these positive trends are: an increase in the size of net assets and revenue, a significant share of small businesses in the total revenue, a high level of competition, an increase in the return on investment.
The most significant negative trend is the growth of net losses over the past five years.
To analyze the activities of the sector in Globas, the Information Agency Credinform has selected the largest road freight transport companies with the highest annual revenue (TOP 1000), according to the data from the Statistical Register and the Federal Tax Service for the latest available periods (2015 – 2020).
Net assets are total assets less total liabilities. This indicator reflects the real value of the property of an enterprise. When the company’s debt exceeds the value of its property, the indicator is considered negative (insufficiency of property).
The largest company in term of net assets is LLC GAZPROMNEFT - SNABZHENIE, INN 5501072608, Omsk region. In 2020, net assets value of the company almost reached 5,8 billion RUB.
The lowest net assets value among TOP 1000 belonged to LLC VSF LOGISTIC, INN 5009061039, Moscow region. The legal entity is declared insolvent (bankrupt) and bankruptcy proceedings are initiated on 06.03.2020. In 2020, insufficiency of property of the enterprise was indicated in negative value of -378 million RUB.
Covering the ten-year period, the average net assets values and their growth rate have a trend to increase (Picture 1).
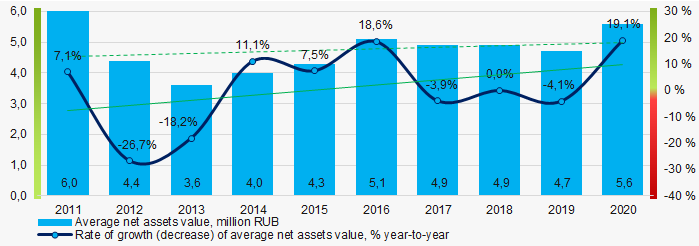 Picture 1. Change in average net assets values in 2011 – 2020
Over the past five years, the share of companies with insufficient property had a positive trend to decrease (Picture 2).
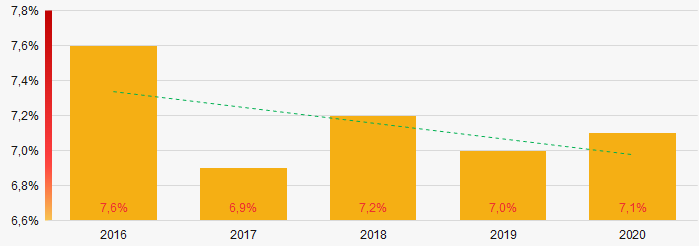 Picture 2. Shares of TOP 1000 companies with negative net assets value in 2016-2020
Sales revenue
In 2020, the revenue volume of ten largest companies was 22% of total TOP 1000 revenue (Picture 3). This is indicative of a relatively high level of competition in the sector.
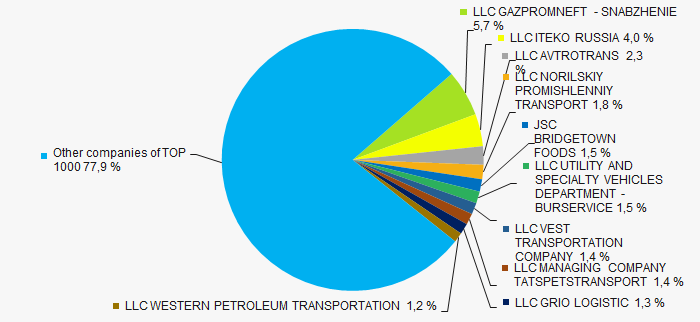 Picture 3. The share of TOP 10 companies in total 2020 revenue of TOP 1000
Covering the ten-year period, there is a trend to increase in revenue and its growth rate (Picture 4).
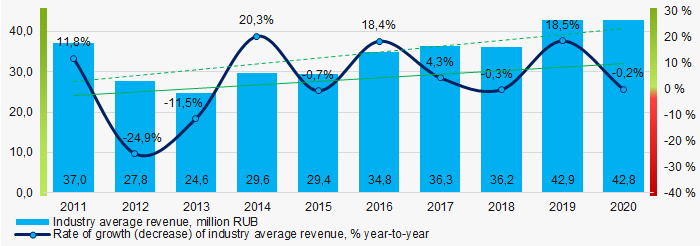 Picture 4. Change in average revenue in 2011 – 2020
Profit and loss
In 2020, the largest organization in term of profit was LLC WESTERN PETROLEUM TRANSPORTATION, INN 7705486752, Moscow. The company’s profit amounted to 1,1 billion RUB.
Covering the ten-year period, there is a trend to increase in industry average net profit and growth rate (Picture 5).
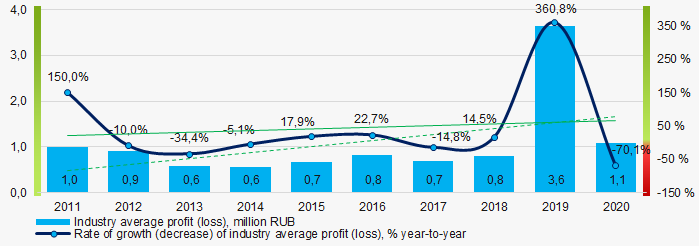 Picture 5. Change in industry average profit (loss) values of in 2012 – 2020
For the five-year period, the average net profit values have multidirectional trend to increase (Picture 6).
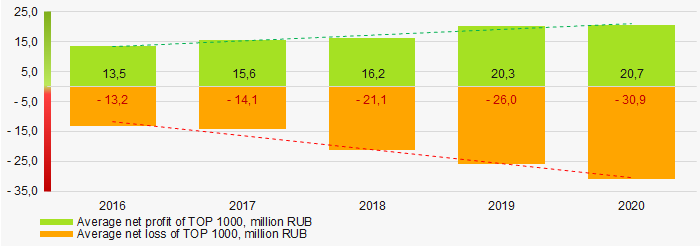 Picture 6. Change in average net profit and net loss of ТОP 1000 in 2016 - 2020
Key financial ratios
Covering the ten-year period, the average values of the current liquidity ratio were within the recommended one - from 1,0 to 2,0 with a trend to a slight decrease (Picture 7).
Current liquidity ratio (current assets to short-term liabilities) shows the sufficiency of company’s assets to repay on short-term liabilities.
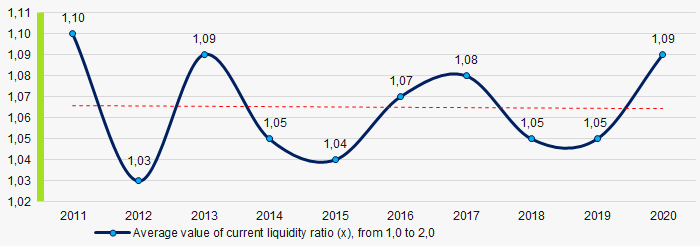 Picture 7. Change in industry average values of current liquidity ratio in 2011 – 2020
Covering the ten-year period, the average values of ROI ratio had a trend to increase (Picture 8).
ROI ratio is calculated as net profit to sum of shareholders equity and long-term liabilities, and shows the return of equity involved in commercial activities and long-term borrowed funds.
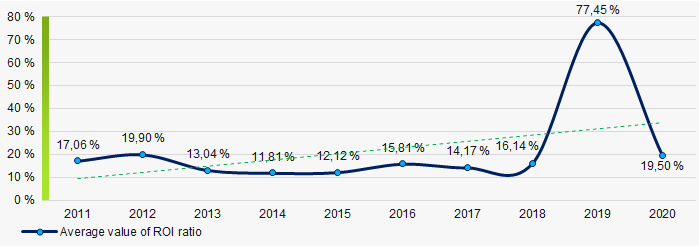 Picture 8. Change in industry average values of ROI ratio in 2011 - 2020
Assets turnover ratio is the ratio of sales revenue and company’s average total assets for a period. It characterizes the effectiveness of using of all available resources, regardless the source of their attraction. The ratio shows how many times per year the full cycle of production and circulation is performed, generating the corresponding effect in the form of profit.
Covering the ten-year period, business activity ratio demonstrated the decreasing trend (Picture 9).
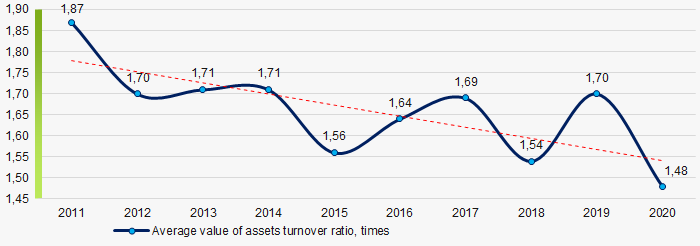 Picture 9. Change in average values of assets turnover ratio of TOP 1000 in 2011 – 2020
Small business
86% of companies of TOP 1000 are registered in the Register of small and medium-sized enterprises of the Federal Tax Service of the Russian Federation. In 2020, their share in total revenue of TOP 1000 was 41%, twice higher than the average country values in 2018-2019 (Picture 10).
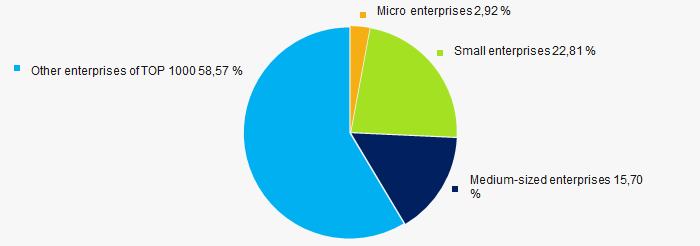 Picture 10. Shares of small and medium-sized enterprises in TOP 1000
Main regions of activity
Companies of TOP 1000 are registered in 78 regions (89% of the RF subjects), and unequally located across the country. Almost 61% of TOP 1000 companies largest by total 2020 revenue are located in ten regions Russia (Picture 11).
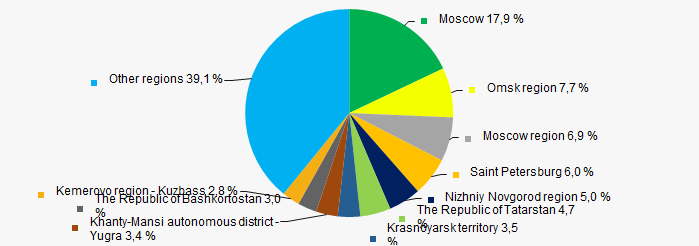 Picture 11. Distribution of TOP 1000 revenue by regions of Russia
Financial position score
Assessment of the financial position of TOP 1000 companies shows that the majority of them have average financial position (Picture 12).
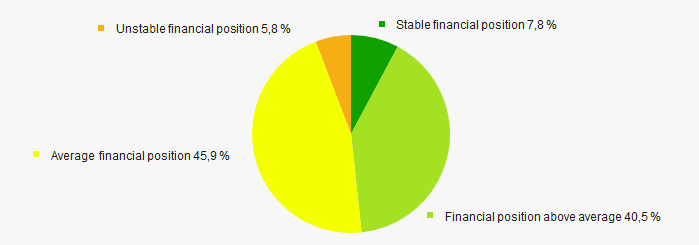 Picture 12. Distribution of TOP 1000 companies by financial position score
Solvency index Globas
Most of TOP 1000 companies got Superior / High and Strong / Medium indexes Globas. This fact shows their limited ability to meet their obligations fully (Picture 13).
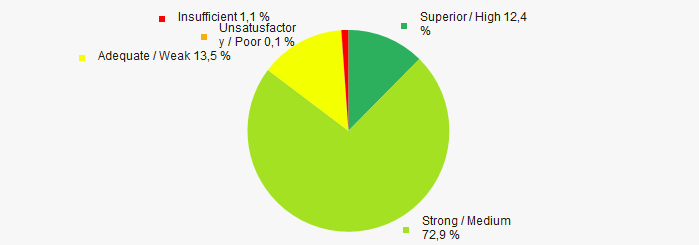 Picture 13. Distribution of TOP 1000 companies by solvency index Globas
Conclusion
Complex assessment of activity of largest road freight transport companies, taking into account the main indexes, financial ratios and indicators, demonstrates the prevalence of positive trends in their activities in 2011 - 2020 (Table 1).
| Trends and evaluation factors | Relative share of factors, % |
| Dynamics of the average net assets value | |
| Rate of growth (decrease) in the average size of net assets | |
| Increase (decrease) in the share of enterprises with negative values of net assets | |
| Level of competition / monopolization | |
| Dynamics of the average revenue | |
| Rate of growth (decrease) in the average size of revenue | |
| Dynamics of the average profit (loss) | |
| Rate of growth (decrease) in the average profit (loss) | |
| Growth / decline in average values of companies’ net profit | |
| Growth / decline in average values of companies’ net loss | |
| Increase / decrease in average values of total liquidity ratio | |
| Increase / decrease in average values of return on investment ratio | |
| Increase / decrease in average values of asset turnover ratio, times | |
| Share of small and medium-sized businesses in terms of revenue being more than 20% | |
| Regional concentration | |
| Financial position (the largest share) | |
| Solvency index Globas (the largest share) | |
| Average value of relative share of factors | |
![]() positive trend (factor),
positive trend (factor), ![]() negative trend (factor)
negative trend (factor)