
Order a report
Custom-made industry research, company ratings, competitor analysis


Activity trends of the largest Russian furniture manufacturing enterprises
Information agency Credinform represents an overview of activity trends of the largest Russian furniture manufacturing enterprises.
Furniture manufacturing enterprises with the largest volume of annual revenue (TOP-10 and TOP-1000) were selected for the analysis, according to the data from the Statistical Register for the latest available periods (for 2013 - 2017). The analysis was made on the basis of the data of the Information and Analytical system Globas.
Net assets are an indicator, reflecting the real value of company’s property, is calculated annually as the difference between assets on the enterprise balance and its debt obligations. The indicator of net assets is considered negative (insufficiency of property), if company’s debt exceeds the value of its property.
| № | Name, INN, region, type of activity | Net assets value, mln RUB |
Solvency index Globas | ||||
| 2015 | 2016 | 2017 | |||||
| 1 | 2 | 3 | 4 | 5 | 6 | ||
| 1 | BYUROKRAT LLC INN 5048035314 Moscow region Furniture production for offices and trade enterprises |
0.8 | 1183.0 | 3042.6 | 205 Strong | ||
| 2 | BOROVICHI-MEBEL NJSC INN 5320017595 Novgorod region Furniture production for offices and trade enterprises |
2257.4 | 2530.2 | 2892.8 | 194 High | ||
| 3 | MEBELNAYA KOMPANIYA LEROM LLC INN 5834023068 Penza region Manufacture of other furniture |
2503.3 | 2755.6 | 2876.8 | 216 Strong | ||
| 4 | OPYTNYI ZAVOD MIKRON NJSC INN 6002005478 Pskov region Furniture production for offices and trade enterprises |
1670.1 | 2216.4 | 2839.5 | 177 High | ||
| 5 | INDUSTRIAL COMPANY ANGSTREM LLC INN 3662128110 Voronezh region Manufacture of other furniture |
1111.0 | 1449.8 | 1645.0 | 174 High | ||
| 996 | BRIGANTINA LLC INN 3908030661 Kaliningrad region Furniture production for offices and trade enterprises |
-78.1 | -74.3 | -74.1 | 320 Adequate | ||
| 997 | TEKHSERVIS LLC INN 5016013734 Moscow region Furniture manufacture |
-96.9 | -94.8 | -101.2 | 245 Strong | ||
| 998 | FOREMA-KUKHNI NJSC INN 7720123922 Moscow region Furniture production for offices and trade enterprises Process of being wound up, from 10.12.2015 |
-44.0 | -44.6 | -138.0 | 600 Unsufficient | ||
| 999 | APSHERONSKII LES NJSC INN 2325022191 Krasnodar territory Furniture manufacture Bankruptcy claim was filed against the company |
-111.2 | -183.6 | -258.8 | 400 Weak | ||
| 1000 | NOVO MEBEL NJSC INN 7114020170 Tula region Furniture manufacture |
-702.1 | -641.8 | -844.6 | 329 Adequate | ||
— increase in the indicator to the previous period, — decrease in the indicator to the previous period.
The average values of net assets of TOP-1000 enterprises tend to decrease over the ten-year period (Picture 1).
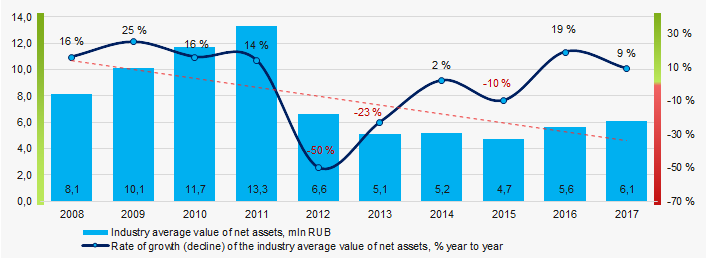 Picture 1. Change in the industry average indicators of the net asset value of furniture manufacturing enterprises in 2008 – 2017
The share of enterprises with insufficiency of assets is declining in the last three years (Picture 2).
 Picture 2. Share of enterprises with negative values of net assets in TOP-1000
Sales revenue
The revenue volume of 10 industry leaders made 24% of the total revenue of TOP-1000 companies in 2017. (Picture 3). It points to a high level of competition in the industry.
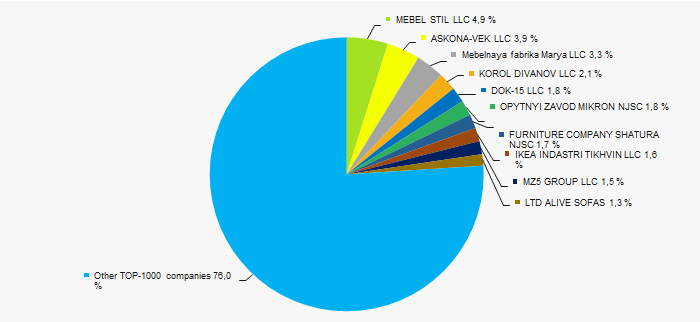 Picture 3. Shares of participation of TOP-10 companies in the total revenue of TOP-1000 enterprises for 2017
In general, there is a trend towards a decrease in revenue volume over the ten-year period (Picture 4).
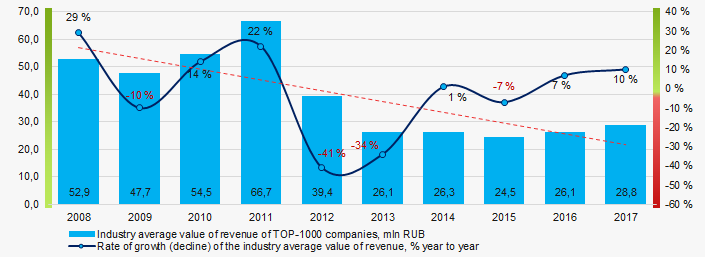 Picture 4. Change in the industry average revenue of furniture manufacturing enterprises in 2008 – 2017
Profit and losses
The profit volume of 10 industry leaders made 30% of the total profit of TOP-1000 companies in 2017 (Picture 5).
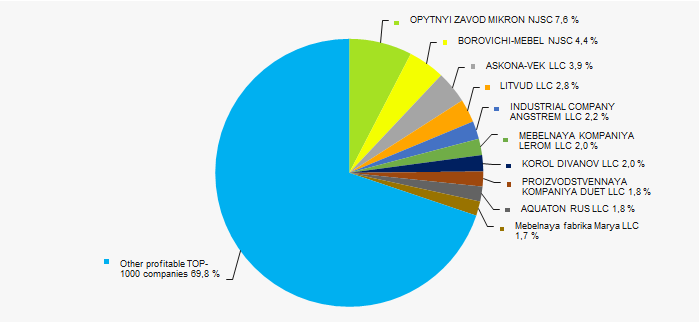 Picture 5. Shares of participation of TOP-10 companies in the total volume of profit of TOP-1000 enterprises for 2017
Industry average values of net profit’s indicators period trend to decrease over the ten-year (Picture 6).
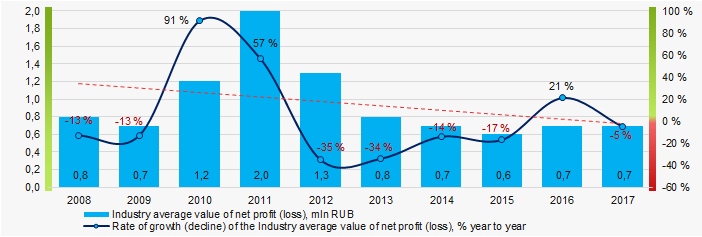 Picture 6. Change in the industry average values of net profit of furniture manufacturing enterprises in 2008 – 2017
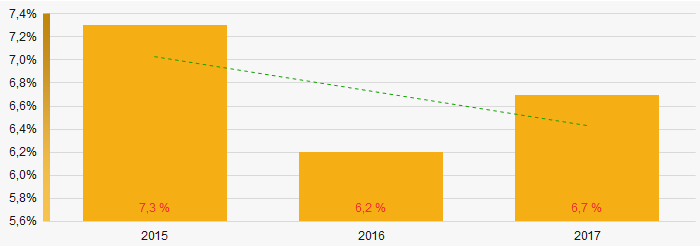
Industry average values of net profit’s indicators of TOP-1000 companies tend to decrease for the three-year period, while the average value of net loss also decreases (Picture 7).
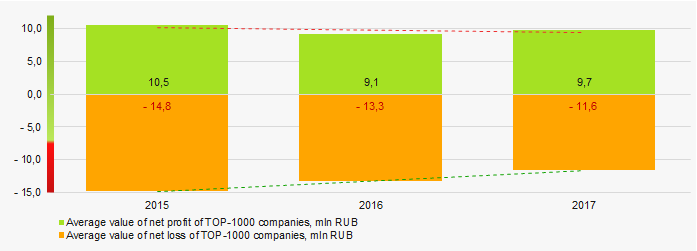 Picture 7. Change in the average values of indicators of profit and loss of TOP-1000 companies in 2015 – 2017
Key financial ratios
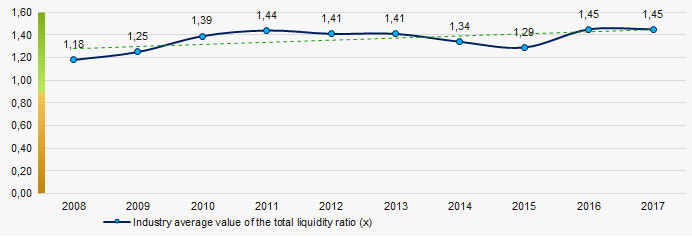 Picture 8. Change in the industry average values of the total liquidity ratio of furniture manufacturing enterprises in 2008 – 2017
There has been a trend towards an increase in the industry average values of the return on investment ratio for ten years (Picture 9). The ratio is calculated as the relation of net profit to the sum of own capital and long-term liabilities and demonstrates the return on the equity involved in the commercial activity of own capital and the long-term borrowed funds of an organization.
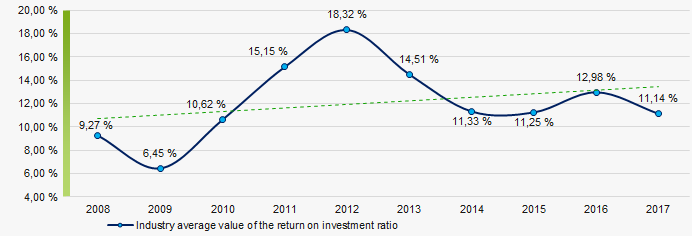 Picture 9. Change in the industry average values of the return on investment ratio of furniture manufacturing enterprises in 2008 – 2017
Asset turnover ratio is calculated as the relation of sales proceeds to the average value of total assets for a period and characterizes the efficiency of use of all available resources, regardless of the sources of their attraction. The ratio shows how many times a year a complete cycle of production and circulation is made, yielding profit. This ratio of business activity showed a tendency to decrease over the ten-year period (Picture 10).
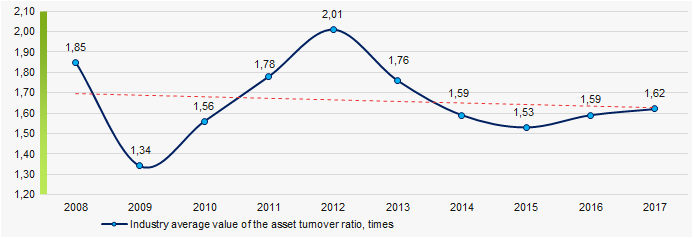 Picture 10. Change in the industry average values of the asset turnover ratio of furniture manufacturing enterprises in 2008 – 2017
Production structure
The largest share in the total revenue of TOP-1000 is owned by companies, specializing in manufacture of other furniture, i.e. sofas, sofa beds and sofa sets; garden chairs and seats; furniture for bedrooms, living rooms, gardens; casings for sewing machines, TVs etc. (Picture 11).
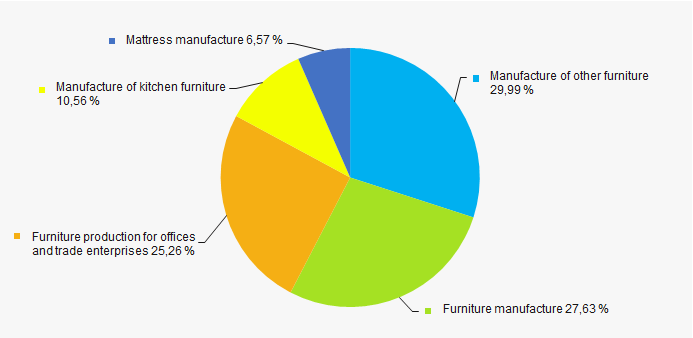 Picture 11. Distribution of types of output in the total revenue of TOP-1000 companies, %
92% of TOP-1000 companies are registered in the Register of small and medium-sized businesses of the Federal Tax Service of the RF. At the same time, their share in the total revenue of TOP-1000 enterprises amounted to 49% in 2017 (Picture 12).
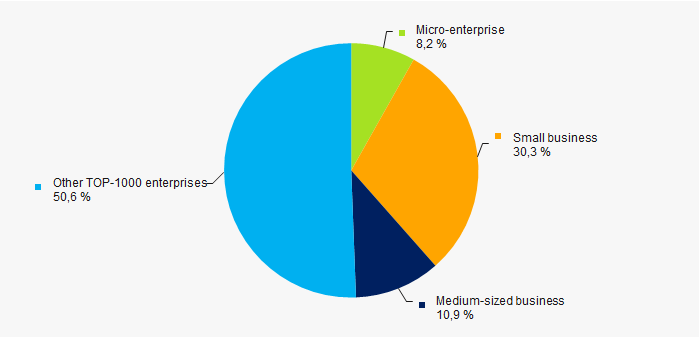 Picture 12. Shares of proceeds of small and medium-sized businesses in TOP-1000 companies, %
Main regions of activity
The TOP-1000 companies are distributed unequal on the Russian territory and registered in 70 regions. The largest enterprises in terms of revenue volume are concentrated in Moscow region and Moscow (Picture 13).
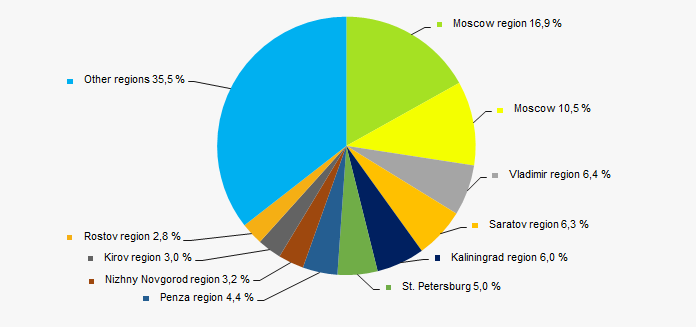 Picture 13. Distribution of the revenue of TOP-1000 companies by regions of Russia
Financial position score
An assessment of the financial position of TOP-1000 companies shows that almost half of them are in a stable financial position and above the average (Picture 14).
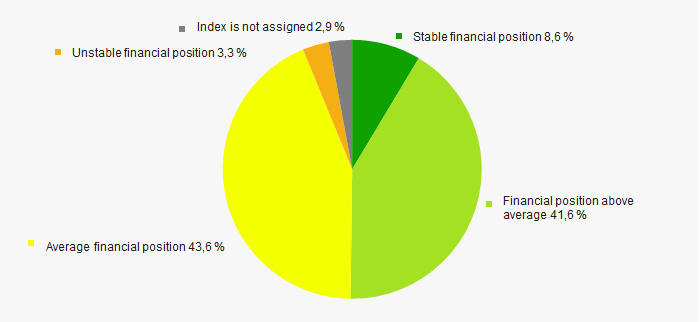 Picture 14. Distribution of TOP-1000 companies by financial position score
Solvency index Globas
Most of TOP-1000 companies got Superior/High or Strong Solvency index Globas, that points to their ability to pay off their debts in time and fully (Picture 15).
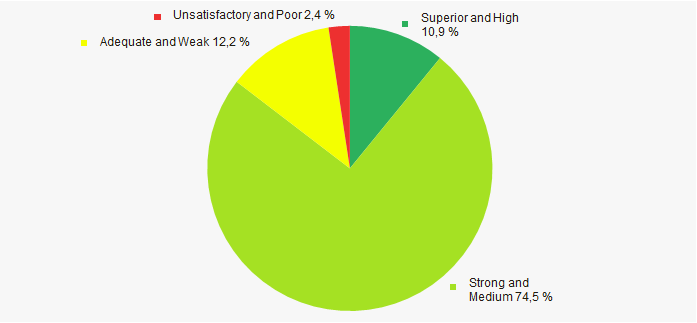 Picture 15. Distribution of TOP-1000 companies by solvency index Globas
Conclusion
A comprehensive assessment of activity of the largest Russian furniture manufacturing enterprises, taking into account the main indices, financial indicators and ratios, points to favorable trends. However, negative and alarming factors are: decrease in industry average indicators of net assets, revenue, net profit and industry average values of the asset turnover ratio.
According to the Federal Service of State Statistics (Rosstat), the tendency to some increase in the values of industrial production indices of furniture manufacture is observed in 2017 – 2018, as a whole (Picture 16). For the period from September 2017 to August 2018, industrial production index of furniture manufacture grew by an average of 1,3%, however an average decline in the index by 0,4% is observed over 8 months of 2018.
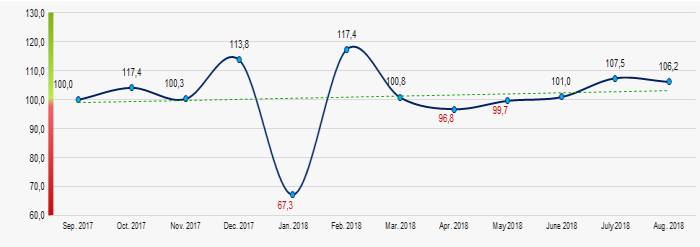 Picture 16. Industrial production index of furniture manufacture in 2017 - 2018, month to month (%)