Article
Runaway prices rise

According to Rosstat, consumer price index in June 2015 dropped by 0,2 percentage points in comparison with May 2015, when the index amounted to 0,4% (graph 1). Over a period of the first half of 2015 the inflationary indicator has been reducing. The dynamics of industrial goods producer price index has a differently directed curve. 

prices rise 2015

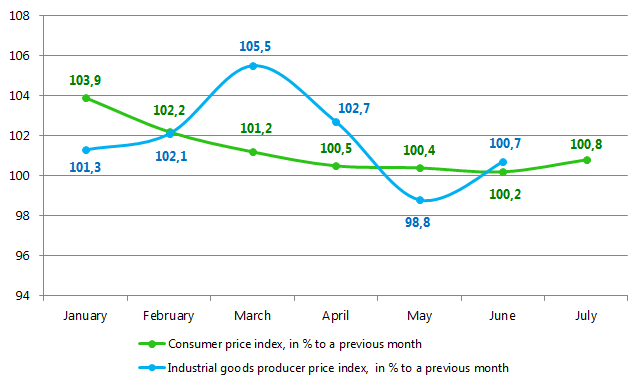
Graph 1. Change in index of consumer and producer prices for January-June 2015. 

In whole the annual inflation by consumer price index as of July 1st, 2015 is noted at the level of 15,3% (graph 2), following the results of 6 months – 8,4%. Producer price index achieved the level of 13,1% at an annual rate, following the results of 6 months – 11,1%.

2015

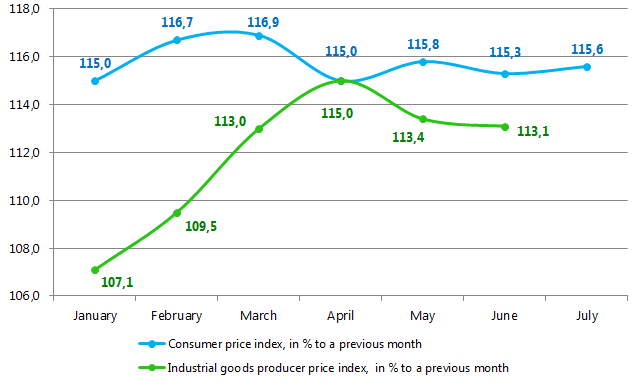
Graph 2. Change in index of consumer and producer prices at an annual rate

The information concerning consumer prices index appeared in the beginning of August 2015 bears evidence to the fact that inflation in Russia accelerated to 0,8% against 0,2% in June. Accordingly the consumer prices at an annual rate increased by 15,6% and since the beginning of this year the inflation amounted to 9,2%.
According to experts of the Information agency Credinform, the key factor of the growth acceleration is the increase of housing and community amenities rate happened as of July 1st, 2015. The communal services costs went up at least by 6,0%-7,5%, in particular: hot water – by 6,3%, electricity - by 6,1%, cold water – by 6,0%, heating system – by 5,4%.

The analysts put on the second place the expected tendencies of the ruble devaluation in relation to dollar as a result of declining oil prices. In June the average price of Urals oil descended by 2,3 percentage points. At the moment the oil price is lower than 50 USD/bl. In this context Russian manufacturers raise the prices on petrol in order to compensate for losses appeared after sale of oil abroad. By doing so, they make their contribution to widening of inflation spiral.

The actions of the Central Bank of Russia led to the ruble devaluation in June-July 2015, too. The Bank started replenishing the exchange reserves, having considered that the ruble was strengthening too fast. However in the beginning of August 2015 the Bank of Russia announced the stopping of purchasing due to significant devaluation of ruble being under strong pressure of falling oil price.

Among other risks capable of cooling down the inflation, the experts of Information agency Credinform note the following ones:

  • further devaluation of ruble;
  • restocking of wholesalers’ products at the new price, that customarily happens in the third quarter of the year;
  • upselling of currency for clearing of taken credits, payments of deposits etc. ;
  • burst of consumption against the backdrop of reduction in import deliveries volume in Russia and fall-off domestic production level.


Ranking
Debt to assets ratio of Russian printing companies

Information agency Credinform prepared a ranking of Russian printing companies.

The companies with the highest volume of revenue were selected for this ranking according to the data from the Statistical Register for the latest available period (for the year 2013). These enterprises were ranked by decrease in total sales revenue per annum. The debt to assets ratio was calculated for each company got shortlisted in TOP-10, TOP-100 lists.

Debt to assets ratio (х) is the relation of long-term and short-term liabilities to total assets. It shows what proportion of assets of an enterprise is funded with debt.

Recommended value is: from 0,2 to 0,5. If the ratio is above the upper standard value, it can point to a potential investor to an excessive debt load of a company, which promotes its market development, however, has a detrimental effect on the stability of the corporate finance. But if the ratio is below the lower standard value, then we may talk about conservative strategy of the financial management, care in attracting of new borrowings.

It should be understood, that recommended values can differ essentially as well for enterprises of different

activity fields, as for organizations of the same industry, consequently, these values are exclusively of informational character.

For getting of the most comprehensive and fair picture of the financial standing of an enterprise it is necessary to pay attention not only to average values of indexes in the industry, but also to all combination of financial indicators and ratios of a company.

Table 1. Revenue, debt to assets ratio, solvency index of the largest printing companies in Russia
NameRegionRevenue, in mln RUB, for 2013Debt to assets ratio, (х)Solvency index GLOBAS-i®
1 Goznak FGUP
INN 7813352058
Saint-Petersburg 43 169 0,2 177 the highest
2 NPO Kripten OJSC
INN 5010020686
Moscow region 4 253 0,3 142 the highest
3 Oldi plys LLC
INN 7726609934
Moscow 3 652 1,0 264 high
4 Pervaya Obraztsovaya Tipografiya OJSC
INN 7705709543
Moscow 2 980 0,2 201 high
5 Pervy poligrafichesky kombinat LLC 
INN 5024051807
Moscow region 2 486 0,5 243 high
6 Poligrafichesky kompleks Ekstra M JCS
INN 5024065038
Moscow region 2 073 1,0 329 satisfactory
7 AlmazPress OJSC
INN 7703183209
Moscow 1 778 0,9 286 high
8 KonfleksSPb OJSC
INN 7806109091
Saint-Petersburg 1 699 0,7 224 high
9 MDM-Pechat LLC
INN 7813096904
Leningrad region 1 580 0,4 160 the highest
10 SPb Obraztsovaya Tipografiya OJSC
INN 7825071848
Saint-Petersburg 1 409 0,6 203 high

Five from ten (TOP-10) the largest printing companies of Russia in terms of revenue demonstrate a high dependence on borrowed funds: the debt to assets ratio is above the upper standard value. Industry leader – the state enterprise FGUP Goznak, on the contrary, follows moderate borrowing policy, without a sharp increase of its credit portfolio, relying mainly on budgetary inflows (in contrast to commercial companies).

printing companies

Picture 1. Net profit and debt to assets ratio of the largest printing companies of the RF (TOP-10)

Annual revenue of the largest printing companies in Russia (TOP-10) amounted to 65,1 bln RUB, according to the latest published annual financial statements (for 2013), that is by 3,9% lower than the figure recorded a year earlier (67,2 bln RUB). It should be noted that most of the revenue of the leading enterprises of the industry is accumulated by FGUP Goznak, issuing national currency banknotes, stamps, security documents, security paper, excise marks, general-purpose industrial grade paper.

The rest participants of the ranking organizations of the commercial sector, whose business is focused on the printing of newspapers, magazines, advertising materials, books etc; their revenue is much lower than that of a state-owned enterprise.

Nine enterprises in the TOP-10 list got high and the highest solvency index. This fact can testify that the organizations can pay off their debts in time and fully, while risk of default is minimal.

«Poligrafichesky kompleks «Ekstra M» got satisfactory solvency index, mainly due to the net loss from main activity over the last few years.