Article
Supreme Court explained the changes in the field of Economic Criminal Law

In July 2016 the amendments to the Criminal Code and the Criminal-Procedural Code of the Russian Federation, which transferred the number of crimes from criminal to administrative offences, were adopted. Among such crimes are: the non-payment of alimony, beatings, petty stealing amounted up to 2 500 RUB. The punishments for bribes and corrupt payment were changed depending on the amount, appearing in the case. Besides, the individuals, who committed the crime for the first time, as well as those, who actively cooperating with the investigation, may be exempted from criminal liability.

The Supreme Court of the Russian Federation gave special comments on application of these humane amendments.

In particular, the comments regarding petty bribery and petty corrupt payment were made. These are the new articles of the Criminal Code. The sum up to 10 000 RUB may be considered as petty bribery and petty corrupt payment. The following fines are intended for such crimes: 200 000 RUB – for petty bribery, 150 000 RUB – for petty corrupt payment.

The Supreme Court explained that the decisions on causing the heavy damage and particularly heavy damage in some cases are subject to review. Since July 2016 the damage more than 2 500 000 RUB is considered as heavy, more than 9 000 000 RUB - as particularly heavy damage. Previously, these amounts were respectively 1 500 000 and 6 000 000 RUB. Thus the court's decision against the individuals, who committed crimes on smaller amounts, may be commuted or they may be exempted from criminal liability.

The Supreme Court also gave comments regarding the review of cases on theft of property by steal, fraud, misappropriation or embezzlement when the theft does not exceed 2 500 RUB. Such crimes are considered as petty theft and lead to administrative responsibility. However the repeated commission of the crimes brings to criminal liability.

The relevance of the government's measures on humanization of criminal law focused on the improvement of business conditions in the country can be assessed after reviewing the statistical data of the Judicial Department at the Supreme Court of the Russian Federation on status of criminal records in Russia for the first half of 2016. (Table 1, Pictures 1, 2).

Table 1. The number of convicted individuals for economic crimes under general articles of the Criminal Code of the Russian Federation for the first half of 2016 (number of persons)
Types of crimesThe articles of the Criminal Code of the Russian FederationThe number of convicted individualsThe number of justified individualsThe number of individuals, against whom the criminal proceedings were discontinued for various reasons
Economic crimes
Total:
158-204 151 659 108 45 741
including the articles of the Criminal Code of the Russian Federation:        
The theft 158 104 251 16 36 119
Robbery 161 15 485 0 1 952
Fraud 159 10 482 40 3 030
Illegal seizure of a vehicle or another transportation facility with no intent to theft 166 6 496 1 1 290
Robbery with violence 162 4 733 3 17
Misappropriation or embezzlement 160 4 198 28 965
Deliberate destruction or damage of property 167 2 303 4 1 792
Extortion 163 957 3 80
Acquisition or sale of property, obtained by criminal means 175 711 1 98
Illegal business operations 171 634 1 48

Most of citizens were convicted for the theft, robbery and fraud (Picture 1).

The number and share of convicted individuals under the articles of the Criminal Code of the Russian Federation in general number of convicted individuals for economic crimes
Picture 1. The number and share of convicted individuals under the articles of the Criminal Code of the Russian Federation in general number of convicted individuals for economic crimes.

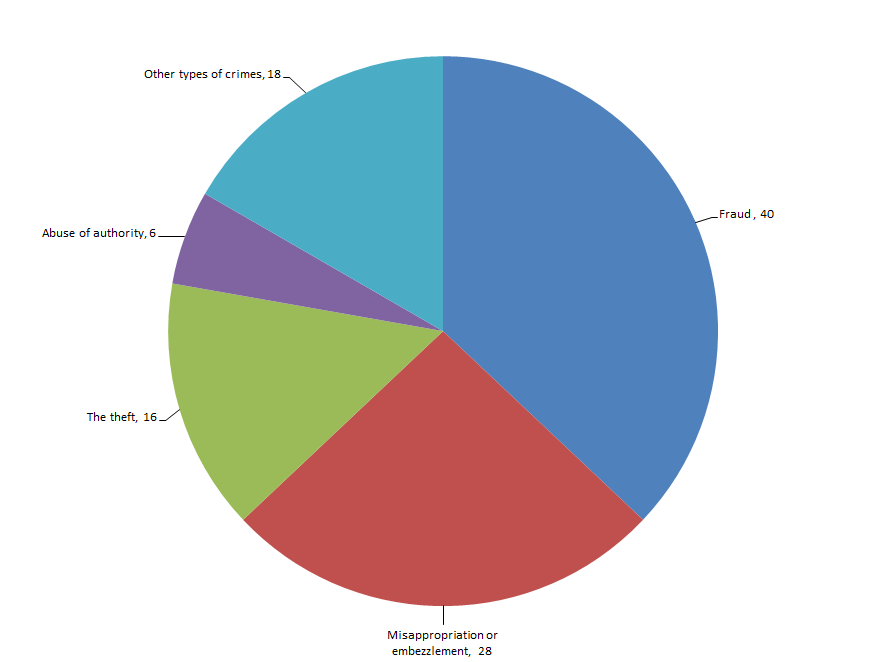
Herein most of acquittal judgements were determined under the articles on fraud, misappropriation or embezzlement and the theft (Picture 2).

The number and share of justified individuals under the articles of the Criminal Code of the Russian Federation in general number of justified individuals for economic crimes
Picture 2. The number and share of justified individuals under the articles of the Criminal Code of the Russian Federation in general number of justified individuals for economic crimes
Ranking
The largest Russian manufacturers of metal pipes on the asset/liability ratio

Information agency Credinform prepared the ranking of Russian manufacturers of metal pipes. The companies with the highest volume of annual revenue involved in this industry (TOP-10) were selected for the ranking, according to the data from the Statistical Register for the latest available accounting periods (for 2015 and 2014). Then the enterprises were ranked by the asset/liability ratio (Table 1).

Asset/liability ratio (х) is calculated as the relation of long-term and short-term debts to the sum of the balance and points at the share of company's assets funded with loans.

The common recommended value of the index varies from 0,2 to 0,5, and the practical values calculated by the Information agency Credinform using an individual method, which takes into account the actual position of companies in a particular industry, varies from 0,4 to 1,0.

Exceedance of the upper standard value points to an excessive debt overburden, which can stimulate development, but have a negative impact on the stability of corporate finances. The index value, being lower than the standard value, can be indicative of a conservative strategy of financial management and an excess of caution in the attraction of new borrowings.

For getting of the most comprehensive and fair picture of the financial standing of an enterprise it is necessary to pay attention not only to compliance with standard values, but also to all combination of financial indicators and company’s ratios.

Table 1. Net profit, revenue, asset/liability ratio, solvency index GLOBAS-i® of the largest Russian manufacturers of metal pipes (TOP-10)
NameNet profit for 2015, mln RUBRevenue for 2015, mln RUBRevenue for 2015 by 2014, +/- %Asset/liability ratio, (х)Solvency index GLOBAS-i®
SEVERNAYA TRUBNAYA KOMPANIYA LLC
INN 3528179640 Vologda region
106,5 1 586,8 36 0,26 223
High
BELENERGOMASH-BZEM LLC
INN 3123315768 Belgorod region
2 703,4 10 430,4 75 0,53 232
High
NABEREZHNOCHELNINSKY A TRUMPET FACTORY TEM-PO JSC
INN 1650233685 Republic of Tatarstan
75,8 6 435,0 18 0,57 251
High
VYKSA STEEL WORKS JSC VSW
INN 5247004695 Nizhny Novgorod region
9 699,0 134 620,0 40 0,59 212
High
CHELYABINSKII TRUBOPROKATNYI ZAVOD PAO
INN 7449006730 Chelyabinsk region
5 389,0 112 285,3 16 0,75 200
High
VPP JSC
INN 3435900186 Volgograd region
9 325,1 81 897,1 41 0,78 179
The highest
IZHORSKAYA TRUBNAYA KOMPANIYA LLC
INN 7817044086 Leningrad region
21,2 2 752,1 18 0,95 232
High
NTPZ LLC
INN 5031107088 Moscow region
67,3 1 306,7 48 270 0,96 273
High
VOLZHSKIE AVTOMOBILNYE ZAPCHASTI K LEGKOVYM MASHINAM LLC
INN 3435072207 Volgograd region
-107,9 1 352,8 24 1,12 550
Unsatisfactory
SERVICE COMPANY NORTH-WEST PIPE PLANT, LLC
INN 7811458845 Saint-Petersburg
-72,2 2 076,8 18 1,43 314
Satisfactory
Total on the group of TOP-10 companies 27 207,1 354 743,0 32* 0,79*  
Total on the group of TOP-100 companies 26 930,1 369 549,8 30* 0,93*  

*) - the average value on the group of companies

The average value of the asset/liability ratio in the group of TOP-10 companies in 2015 is lower than in the group of TOP-100 companies, by the industry average value amounted to 0,71. At the same time, the indicator values of VOLZHSKIE AVTOMOBILNYE ZAPCHASTI K LEGKOVYM MASHINAM LLC and SERVICE COMPANY NORTH-WEST PIPE PLANT LLC do not fit into the intervals of recommended and practical values.

Asset/liability ratio of the largest Russian manufacturers of metal pipes (TOP-10)
Picture 1. Asset/liability ratio of the largest Russian manufacturers of metal pipes (TOP-10)

The volume of revenue of 10 the largest companies is 96% of the total revenue of 100 the largest enterprises. It points to a very high level of monopolization in this industry. In particular, the share of industry leaders - VYKSA STEEL WORKS JSC VSW and CHELYABINSKII TRUBOPROKATNYI ZAVOD PAO - in the total revenue of the group of TOP-100 companies for 2015 made about 67% cumulatively (Picture 2).

Shares of TOP-10 companies in the total revenue for 2015 of TOP-100 companies, %
Picture 2. Shares of TOP-10 companies in the total revenue for 2015 of TOP-100 companies, %

Eight of TOP-10 enterprises got the highest or high solvency index GLOBAS-i®, that points to their ability to repay their long-term debts timely and fully.

SEVERNAYA TRUBNAYA KOMPANIYA LLC got satisfactory solvency index GLOBAS-i®, due to the information on its participation as a defendant in arbitration court proceedings in terms of debt collection and to the loss in the structure of the balance sheet ratios. The forecast of ratio development remains stable, and credits require guarantees.

VOLZHSKIE AVTOMOBILNYE ZAPCHASTI K LEGKOVYM MASHINAM LLC got unsatisfactory solvency index GLOBAS-i®, due to the application for recognition of the company bankrupt. The probability of financial insolvency in the next 12 months is very high. The forecast of ratio development is negative, and credits are declined.

Three from TOP-10 companies (shown in red in Table 1) made a loss or reduction in the net profit in 2015 compared with the previous period. At the same time, all the enterprises, as well in the group of TOP-10, as in the group of TOP-100, created steadily the volumes of revenue in 2015.

Industry production indicators in physical terms in the period from 2011 to 2016 are not stable, as evidenced by the data calculated on the basis of the information of the Federal State Statistics Service (Picture 3). At the end of 11 months of 2016 there is a decline in production.

The rate of growth / decline in production of metal pipes in real terms from year to year, %
Picture 3. The rate of growth / decline in production of metal pipes in real terms from year to year, %

*) – data for 11 The rate of growth / decline in production of metal pipes in real terms from year to year months of 2016 are shown by corresponding period of 2015

Companies, producing metal pipes, are spread relatively equally within the country’s territory and tend to industrial regions with well-developed infrastructure required for such energy-intensive and high-tech industry. This information is confirmed by the Information and analytical system Globas-i, according to which 100 the largest companies of the industry in terms of revenue for 2015 are registered in 30 regions of Russia (Picture 4).

Distribution of the 100 largest Russian manufacturers of metal pipes on Russian regions
Picture 4. Distribution of the 100 largest Russian manufacturers of metal pipes on Russian regions