Trends among companies of Primorye territory
Information agency Credinform has prepared a review of trends of the largest companies of real economy in Primorye territory.
The largest enterprises (TOP-1000) in terms of annual revenue were selected for the analysis according to the data from the Statistical Register for the latest available periods (2012-2017). The analysis was based on the data of the Information and Analytical system Globas.
Net assets are total assets less total liabilities. This indicator reflects the real value of the property of an enterprise. When the company’s debt exceeds the value of its property, the indicator is considered negative (insufficiency of property).
The largest company of Primorye territory in term of net assets is JSC FAR EASTERN ENERGY MANAGEMENT COMPANY, being in process of reorganization in the form of division since 25.03.2019. In 2017, net assets value of the company amounted to almost 59 billion RUB. The lowest net assets volume among TOP-1000 belonged to JSC ROSDORSNAB, the company is in process of being wound up since 30.11.2016. Insufficiency of property of the company was indicated in negative value of 5,6 billion RUB.
Covering the five-year period, the average net assets values of TOP-1000 companies has a trend to increase (Picture 1).
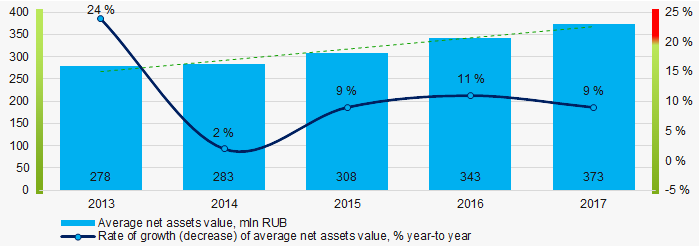 Picture 1. Change in average net assets value in 2013 – 2017
The shares of TOP-1000 companies with insufficient property have trend to decrease over the past five years (Picture 2).
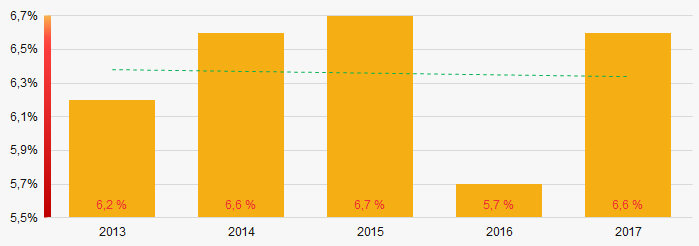 Picture 2. Shares of companies with negative net assets value in TOP-1000
Sales revenue
In 2017, total revenue of 10 largest companies of Primorye territory was 28% of TOP-1000 total revenue (Picture 3). This testifies relatively low level of concentration of production in the region.
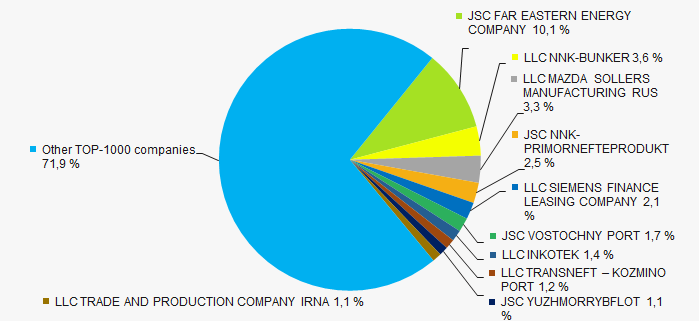 Picture 3. Shares of TOP-10 companies in TOP-1000 total profit for 2017
In general, there is a trend to increase in revenue (Picture 4).
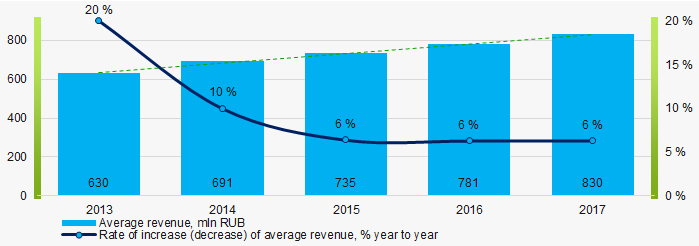 Picture 4. Change in industry average net profit in 2013-2017
Profit and loss
The largest company of TOP-1000 in term of net profit is JSC VOSTOCHNY PORT. The company’s profit for 2017 amounted to 7,2 billion RUB. In general, over the five-year period, there is a trend to increase in average profit of TOP-1000 companies (Picture 5).
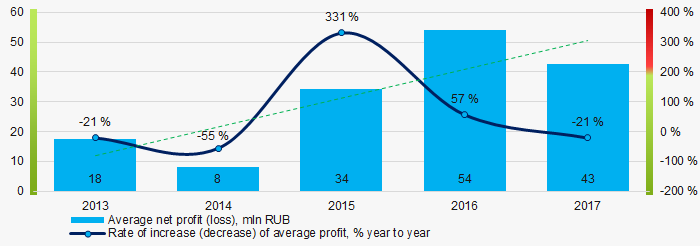 Picture 5. Change in industry average profit values n 2013-2017
For the five-year period, the average net profit values of TOP-1000 companies increased with the average net loss value having the decreasing trend (Picture 6).
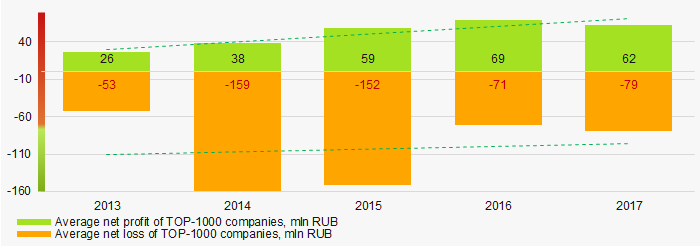 Picture 6. Change in average net profit and net loss of ТОP-1000 in 2013 – 2017
Key financial ratios
For the five-year period, the average values of the current liquidity ratio were above the recommended one - from 1,0 to 2,0 with a trend to decrease (Picture 7).
Current liquidity ratio (current assets to short-term liabilities) shows the sufficiency of company’s assets to repay on short-term liabilities.
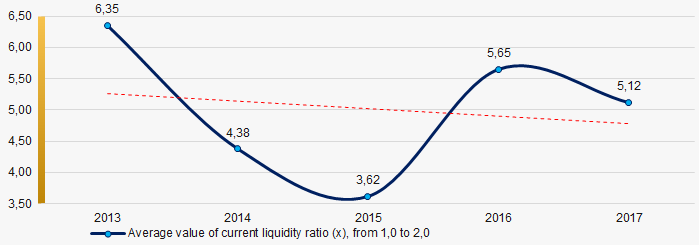 Picture 7. Change in industry average values of current liquidity ratio in 2013 – 2017
For the five-year period, the average values of ROI ratio have the trend to decrease (Picture 8).
ROI ratio is calculated as net profit to sum of shareholders equity and long-term liabilities, and shows the return of equity involved in commercial activities and long-term borrowed funds.
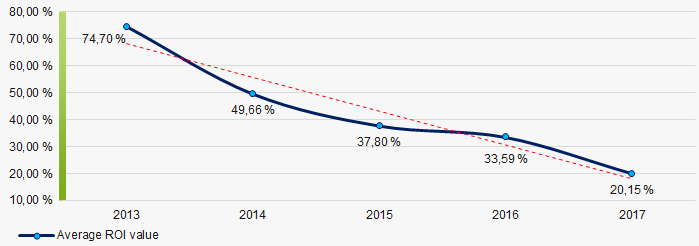 Picture 8. Change in average values of ROI ratio in 2013 – 2017
Assets turnover ratio is the ratio of sales revenue and company’s average total assets for a period. It characterizes the effectiveness of using of all available resources, regardless the source of their attraction. The ratio shows how many times per year the full cycle of production and circulation is performed, generating the corresponding effect in the form of profit.
For the five-year period, business activity ratio demonstrated the decreasing trend (Picture 9).
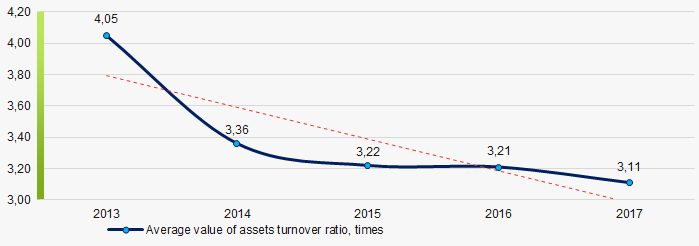 Picture 9. Change in average values of assets turnover ratio in 2013 – 2017
Small enterprises
78% companies of TOP-1000 are registered in the Register of small and medium-sized enterprises of the Federal Tax Service of the Russian Federation. At the same time, their share in total revenue of TOP-1000 amounted to 29% that is higher than the national average figure (Picture 10).
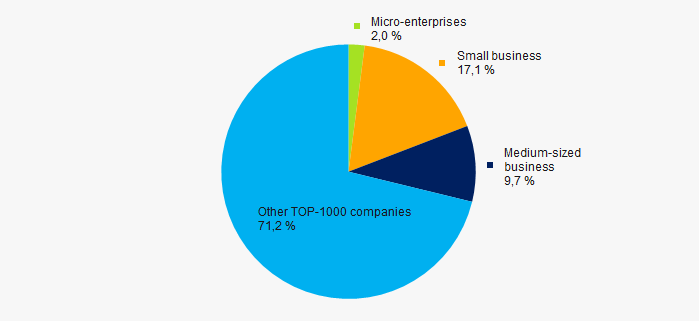 Picture 10. Shares of small and medium-sized enterprises in TOP-1000, %
Main regions of activity
Companies of TOP-1000 are registered in 31 districts of Primorye territory and located across quite unequally. Almost 86% companies largest in term of turnover are concentrated in Vladivostok and Nakhodka (Picture 11).
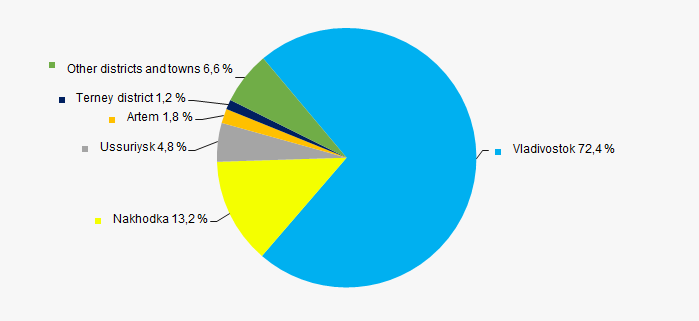 Picture 11. Distribution of TOP-1000 revenue by districts of Primorye territory
Financial position score
Assessment of the financial position of TOP-1000 companies shows that more than a half of them have stable financial position and financial position above average (Picture 12).
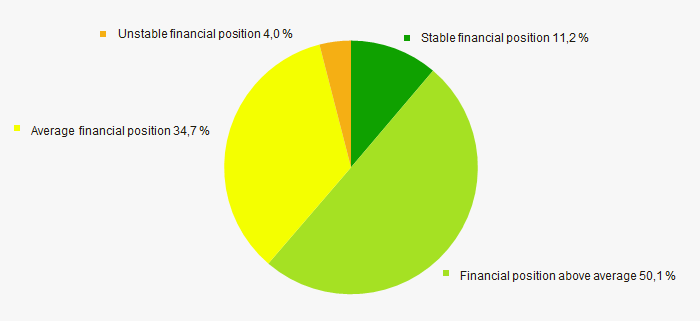 Picture 12. Distribution of TOP-1000 companies by financial position score
Solvency index Globas
Most of TOP-1000 companies got Superior / High and Strong / Medium index Globas. This fact shows their ability to meet their obligations fully (Picture 13).
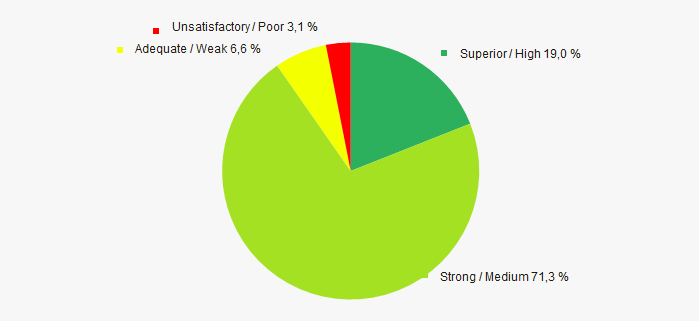 Picture 13. Distribution of TOP-1000 companies by solvency index Globas
Index of industrial production
According to the Federal State Statistics Service (Rosstat), during 12 months of 2018, the trend to decrease of industrial production indexes is observed in Primorye territory (Picture 14). The average month-to-month figure was 98,5%.
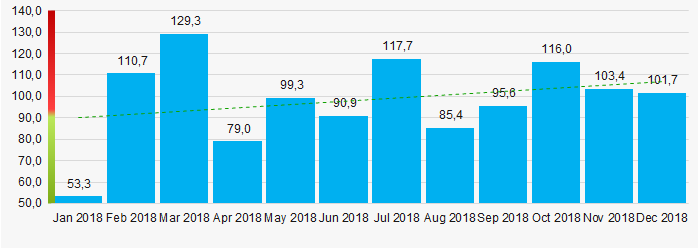 Picture 14. Index of industrial production in Primorye territory in 2018, month-to-month (%)
According to the same data, the share of companies of Primorye territory in the volume of revenue from sales of products, goods, works and services in 2018 was 0,68% countrywide.
Conclusion
Complex assessment of activity of the largest companies of real economy sector in Primorye territory, taking into account the main indexes, financial ratios and indicators, demonstrates the prevalence of positive trends (Table 1).
| Trends and evaluation factors | Relative share of factors, % |
| Rate of growth (decline) in the average size of net assets |  10 10 |
| Increase / decrease in the share of enterprises with negative values of net assets |  10 10 |
| Rate of growth (decline) in the average size of revenue |  10 10 |
| Concentration level of capital |  10 10 |
| Rate of growth (decline) in the average size of profit (loss) |  10 10 |
| Growth / decline in average values of companies’ net profit |  10 10 |
| Growth / decline in average values of companies’ net loss |  10 10 |
| Increase / decrease in average values of total liquidity ratio |  -5 -5 |
| Increase / decrease in average values of return on investment ratio |  -5 -5 |
| Increase / decrease in average values of asset turnover ratio, times |  -10 -10 |
| Share of small and medium-sized businesses in the region in terms of revenue being more than 22% |  10 10 |
| Regional concentration |  -10 -10 |
| Financial position (the largest share) |  10 10 |
| Solvency index Globas (the largest share) |  10 10 |
| Industrial production index |  5 5 |
| Average value of relative share of factors |  5,0 5,0 |
 — positive trend (factor),
  — negative trend (factor).
Patent on technologies shaping the future
The Saint Petersburg International Economic Forum 2019 started on June 06. Traditionally, the participants of the main business event of the year will discuss ways to develop the Russian and world economy.
“Technologies shaping the future”, one of the thematic clusters, is devoted to the problems of digitalization, development of artificial intelligence, new technologies for industry, healthcare, and cybersecurity.
Transformation of business processes and creation of a new technological structure are impossible without introducing innovations. Does Russia take out enough patents for inventions and technologies that can bring the future closer?
The number of patents in Russia is growing
In 2018, the Federal Service for Intellectual Property (Rospatent) received 38 thousand patent applications for inventions that was by 4% more than in 2017. The increase in the number of applications indicates the keeping up patent activity, as well as the existence of intellectual potential and favorable environment for scientific developments. In 2018, there were 256 thousand valid patents for inventions in Russia that is 2,4 times more than in 2004, when this statistics began to be published (see Picture 1).
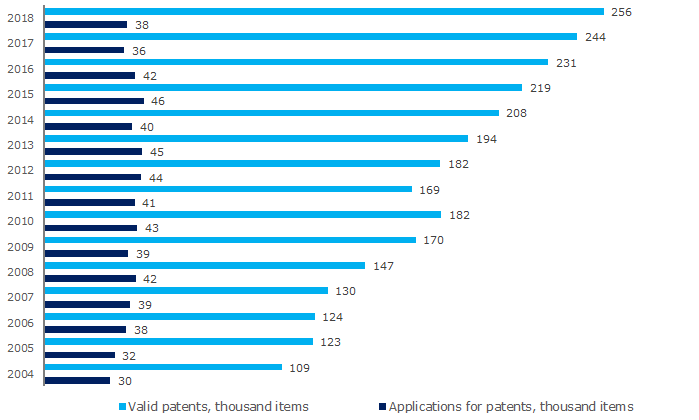 Picture 1. Dynamics of the number of valid patents for inventions and applications for new patents for inventions; 2004-2018; Russia
Patenting in Russia
Medical and measuring technologies, civil engineering, transport, pharmaceuticals, work with new materials, and developments in the energy sector are most attractive for the Russian inventors (see Picture 2).
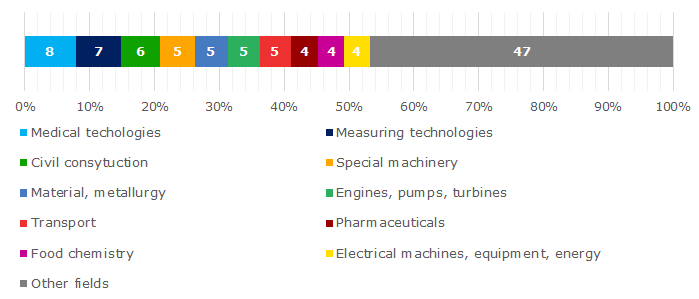 Picture 2. The structure of applications for patents for inventions by fields; 2018; Russia
The Russian engineers and scientists create unique technologies that can increase the competitiveness of the economy: harmonic scalpel (Lomonosov Moscow State University), artificial heart muscle (National Research University of Electronic Technology (MIET)), device for searching underwater objects under the ice (The Krylov State Research Centre), open space microrobot (Ishlinsky Institute for Problems in Mechanics RAS). These and many other inventions in the field of information technology, engineering and robotics are included in the Top-100 best inventions of 2018 according to Rospatent.
Patenting in the world
The leading direction of the global technological development are computing technologies and energy equipment engineering. These areas accumulate more than 16% of all new patent applications in the world (see Picture 3). To limit the use of promising technologies by other companies, corporate giants create large patent packages. For example, the Chinese company Huawei, leading in production of equipment for networks of the fifth generation 5G, owns about 90 thousand patents, including 2,5 thousands for 5G standard.
There is a huge demand for the development of self-learning machines with artificial intelligence, using neural networks and computer vision, due to which fundamentally new production technologies are created.
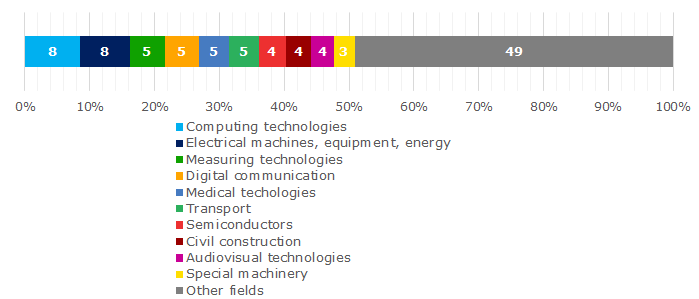 Picture 3. The structure of applications for patents for inventions by fields; 2017; all countries
Russia is in the Top-10 countries by the number of patents and applications for inventions
According to the World Intellectual Property Organization (WIPO), more than 7 million inventions are registered in the USA, China and Japan that is 52% of all valid patents in the world. Russia's share is just 1,8%, but it allowed the country to ranked 9th in the Top-10 (see Table 1).
By the number of new applications for registration of inventions, Russia is ranked 7th. The leading China is far ahead of its closest competitors, including the United States: almost half of global applications for registration of inventions filed in the Middle Kingdom.
Table 1. Top-10 countries by the number of valid patents and applications for registration of inventions; 2017
| Valid patents for inventions | New applications for patents for inventions | ||||||
| Rank | Country | Thousand items | Share, % | Rank | Country | Thousand items | Share, % |
| 1 | USA | 2 985 | 21.9 | 1 | China | 1 382 | 43.6 |
| 2 | China | 2 085 | 15.3 | 2 | USA | 607 | 19.2 |
| 3 | Japan | 2 014 | 14.8 | 3 | Japan | 318 | 10.1 |
| 4 | United Kingdom | 1 244 | 9.1 | 4 | South Korea | 205 | 6.5 |
| 5 | South Korea | 971 | 7.1 | 5 | Germany | 68 | 2.1 |
| 6 | Germany | 658 | 4.8 | 6 | India | 47 | 1.5 |
| 7 | France | 564 | 4.1 | 7 | Russia | 36 | 1.2 |
| 8 | Italy | 298 | 2.2 | 8 | Canada | 35 | 1.1 |
| 9 | Russia | 244 | 1.8 | 9 | Australia | 29 | 0.9 |
| 10 | Switzerland | 208 | 1.5 | 10 | Brazil | 26 | 0.8 |
| Top-10 | 11 270 | 82.6 | Top-10 | 2 752 | 86.8 | ||
| Total, all countries |
13 644 | 100.0 | Total, all countries |
3 169 | 100.0 | ||
Shaping the future
Rich scientific traditions and intellectual potential provide Russia with a position in the Top-10 world centers by the number of patents for inventions. However, according to Rosstat for 2018, only about 6% of the total number of patented inventions has been introduced.
Insufficient protection of intellectual property rights, limited financing of scientific and technical developments, lack of worthy remuneration of inventors, lack of interest of organizations in the development of the intellectual property system are problems that require speedy solutions. Having overcome them, we can rightly say that Russia has technologies shaping the future, inventors to create and entrepreneurs ready to introduce them.