
Order a report
Custom-made industry research, company ratings, competitor analysis


Return on sales of the largest Russian of food retailers
Information agency Credinform offers the ranking of the largest food retail chains of Russia.
The largest enterprises of the retail sales of food products were selected on the highest volume of annual revenue for the ranking for the latest period available in the State statistics authorities (for the year 2014). The TOP-10 of the largest companies was ranked by decrease in the return on sales ratio. (Table 1).
Return on sales (%) is the share of operating profit in company's sales volume. The return on sales ratio reflects the efficiency of industrial and commercial activity of an enterprise and shows, how much money remains with the company as a result of the sale of products after covering its costs, interest payments on loans and discharge of taxes.
Return on sales is an indicator of company’s price policy and its ability to control outlays. The differences in the competitive strategies and product ranges cause a significant variety of return on sales values in companies. Therefore, it should be taken into account that the return on sales of two companies can differ a lot at the equal values of revenue, operating expenses and pre-tax profit under the influence of volumes of interest payments on the net profit margin.
| Name, Trademark, INN, Region | Net profit for 2014, mln RUB | Net profit for 2014, to 2013, % | Revenue for, 2014, mln RUB | Revenue for 2014, to 2013, % | Return on sales, % | Solvency index Globas-i® |
|---|---|---|---|---|---|---|
| AUCHAN LLC (© АШАН) INN 7703270067 Moscow region |
11 934 | 109 | 313 629 | 117 | 4,93 | 219 high |
| AGROTORG LLC (© Пятёрочка, Перекресток, Карусель) INN 7825706086 Saint-Petersburg |
1 089 | 64 | 116 042 | 122 | 3,80 | 250 high |
| TANDER NAO (© Сеть "Магнит") INN 2310031475 Krasnodar territory |
38 151 | 130 | 830 320 | 132 | 2,21 | 212 high |
| TORGOVY DOM PEREKRESTOK NAO (© Перекресток) INN 7728029110 Moscow |
8 760 | 115 | 583 105 | 124 | 1,29 | 222 high |
| ELEMENT-TREID LLC (© ТС "Монетка") INN 6674121179 Sverdlovsk region |
1 180 | 100 | 57 854 | 119 | 0,99 | 218 high |
| DIKSI YUG NAO (© Дикси) INN 5036045205 Moscow region |
1 675 | 649 | 198 420 | 163 | 0,92 | 225 high |
| LENTA LLC (© ЛЕНТА) INN 7814148471 Saint-Petersburg |
6 157 | 92 | 220 338 | 136 | 0,91 | 238 high |
| ATAK LLC (© ATAK) INN 7743543232 Moscow |
1 388 | 107 | 58 023 | 129 | 0,83 | 220 high |
| TD INTERTORG LLC (© "Народная 7Я семьЯ", "идеЯ", "SPAR") INN 7842005813 Leningrad region |
101 | 61 | 55 897 | 133 | 0,09 | 216 high |
| О’КЕY LLC (© О’КЕY Group) INN 7826087713 Saint-Petersburg |
5 993 | 172 | 158 905 | 109 | -0,71 | 219 high |
NAO TANDER, the leader of the industry in term of the annual revenue, shows the return on sales of 2,21% and takes the third place of the ranking.
The average return on sales of the largest enterprises of the retail sales of food products (TOP-10) amounted to 1,52% at year-end 2014, by the industry average value of 2,36%. AUCHAN LLC and AGROTORG LLC, taking the first two places of the ranking, have the return on sales value of 4,93% and 3,80% respectively.
О’КЕY LLC demonstrates a negative value of the return on sales. It testifies that the production cost is higher than the profit from its sale, the price isn’t high enough to cover all costs, and own assets of the company are used inefficiently.
All companies of the TOP-10 finished the year 2014 with a positive trend in revenue and with profit. However, three companies have a decrease in the net profit compared to the previous period.
All companies of the TOP-10 got a high solvency index Globas-i, that points to their ability to pay off their debts in time and fully, while risk of default is minimal.
Picture 1. Revenue and return on sales of the largest food retailers (TOP-10)
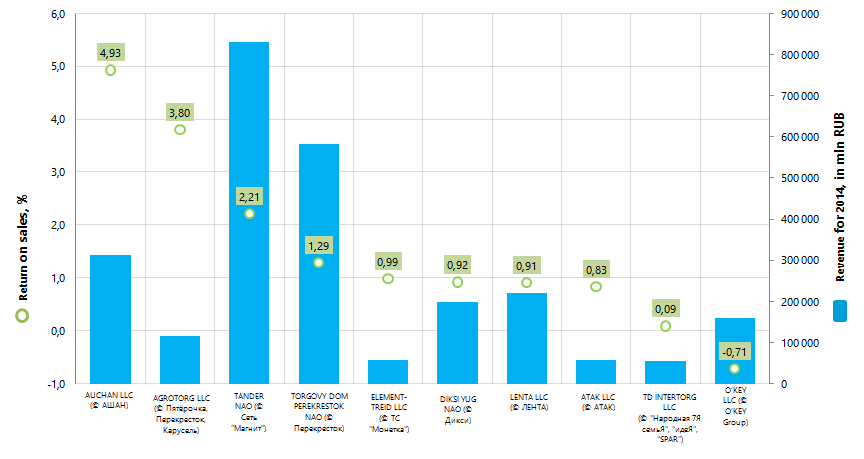
The annual revenue of the companies from the TOP-10 list amounted to 2,59 trillion rubles at the year-end 2014, that is higher by 28% than the consolidated figure in 2013. The indicators of net profit of these enterprises show also a positive dynamics. Thus, the total net profit of the TOP-10 companies, which amounted to 76,4 billion rubles in 2014, increased by 60% compared with the previous year.
Retail trade has been one of the drivers of the economic growth for a long time. In the current complicated economic conditions, in spite of the increased inflation and the decline in effective demand, the industry as a whole continues to show a positive dynamics with a gradual decline in growth rates. This is confirmed by the data of Rosstat on the turnover of retail trade of food, including beverages and tobacco products nationwide (Picture 2, 3).
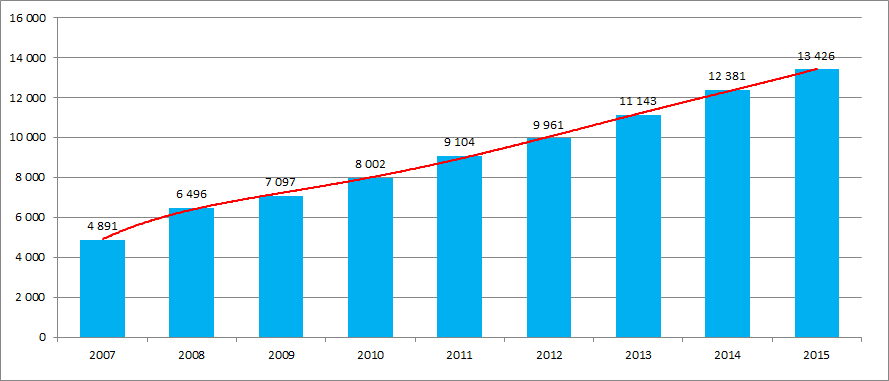
A steady growth of retail trade turnover of food products is observed on the diagram, which wasn’t significantly impacted by crisis developments in the economy in 2008 – 2009 and 2014 – 2015.
Picture 3. Growth rates of the retail trade turnover of food, including beverages and tobacco products (from year to year since 2007, %%)
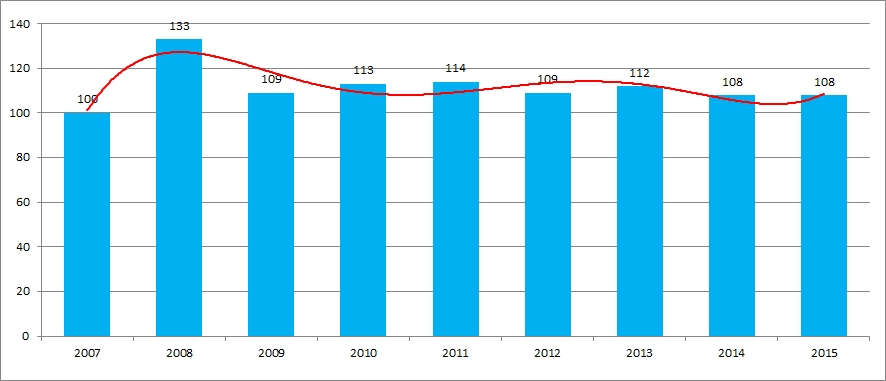
Growth rates of the retail trade turnover of food demonstrate varying indicators from year to year, with a gradual decline starting on 2013. The quarterly analysis shows a similar tendency. In the 1st quarter of 2016 the growth rate was of 4% compared with the same period in 2015.
The retail chain stores are characterized by a high concentration of companies in Moscow and in large industrial centers of the country with the most solvent people. This is confirmed by the data of the Information and analytical system Globas-i on the distribution of 100 the largest companies on revenue in the industry registered across the regions (TOP-12 Regions):
| Region | Number of companies | |
|---|---|---|
| 1. | Moscow | 22 |
| 2. | Saint-Petersburg | 9 |
| 3. | Moscow region | 8 |
| 4. | Krasnoyarsk territory | 4 |
| 5. | Nizhny Novgorod region | 4 |
| 6. | The Republic of Bashkortostan | 4 |
| 7. | Altai Territory | 3 |
| 8. | Volgograd region | 3 |
| 9. | Leningrad region | 3 |
| 10. | The Republic of Tatarstan | 3 |
| 11. | Sverdlovsk region | 3 |
| 12. | Chelyabinsk region | 3 |