Ranking
Inventory turnover ratio of leading meat-processing enterprises in Russia

Information agency Credinform prepared a ranking of leading meat-processing enterprises in Russia, producing mainly finished goods.

The companies with the highest volume of revenue were selected for this ranking according to data from the Statistical Register for the latest available period (for the year 2013). These enterprises were ranked by decrease in inventory turnover ratio.

Inventory turnover (in times) - relation of sales revenue to average inventory value for a period. It shows the speed of realization of inventory.

Inventory turnover characterizes mobility of assets, which an enterprise puts into the stocking: the faster the money put into inventories return to a company as proceeds from sales of finished goods, the higher is the business activity of this organization, efficiency of resources use by the company taking into account the time factor.

There is no recommended value prescribed for this ratio, because the indicator can vary strongly depending on industry sector, where the concrete enterprise operates. However, the higher is its value, the better.

By the analysis of company’s activity it is expedient to take into account the industry-average indicator. 

Table. Sale proceeds, inventory turnover and solvency index of leading meat-processing enterprises in Russia (TOP-10)
NameRegionTurnover, in mln RUB, for 2013Inventory turnover, in timesSolvency indexGLOBAS-i®
1 Ptitsekombinat LLC
INN: 2631029799
Stavropol territory 8 083 78 244 high
2 Starodvorskie kolbasy CJSC
INN: 3328426780
Vladimir region 8 634 38 225 high
3 MPZ Agro-Belogore LLC
INN: 3123183960
Belgorod region 10 907 37 275 high
4 Cherkizovsky myasopererabatyvay ushchyzavod OJSC
INN: 7718013714
Moscow 18 397 36 190 the highest
5 Velikoluksky myasokombinat OJSC
INN: 6025009824
Pskov region 11 188 27 280 high
6 Ostankinsky myasopererabatyvayushchy kombinat OJSC
INN: 7715034360
Moscow 27 240 23 204 high
7 Myasokombinat Dubki LLC
INN: 6432013128
Saratov region 8 663 22 217 high
8 Khalyal Ash LLC
INN: 5050046264
Moscow region 23 342 12 330 satisfactory
9 Agro Invest CJSC
INN: 7710445247
Moscow region 7 860 11 225 high
10 Mikoyanovsky myasokombinat CJSC
INN: 7722169626
Moscow 10 437 9 203 high

meat-processing enterprises

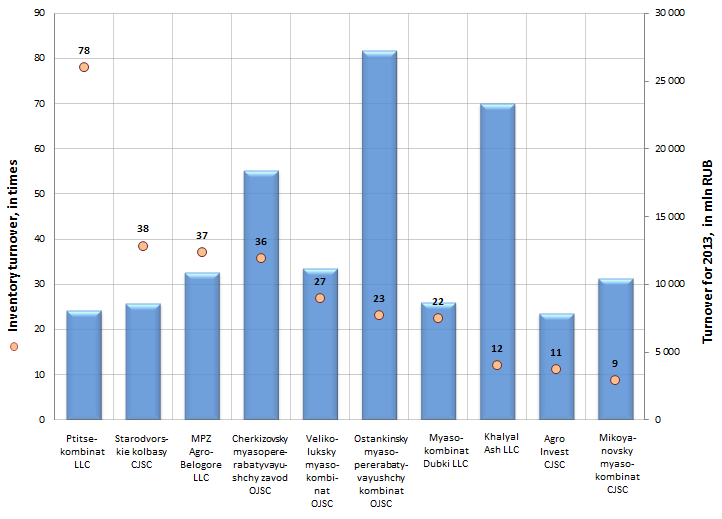
Picture. Sale proceeds and inventory turnover of leading meat-processing enterprises in Russia (TOP-10)

The turnover of the largest Russian meat-processing enterprises (TOP-10) made 134 751 bln RUB, according to the latest published annual financial statement (for the year 2013).

The average value of inventory turnover of TOP-10 organizations is 29 times.

Ostankinsky myasopererabatyvayushchy kombinat OJSC - is the leading Russian manufacturer of products of meat-processing and semi-finished goods, which realizes the complete inventory turnover 23 times a year. In 2013 the sales volume of the plant exceeded 168 thousand tons, thereby consolidated its leading positions in the meat market.

The rate of inventory turnover being higher, than all enterprises average, was showed only by four companies from TOP-10 list – they are as follows:

  • Ptitsekombinat LLC (78 times) - is one of the largest poultry plants in southern Russia;
  • Starodvorskie kolbasy CJSC (38 times) – produces sausage products, ham;
  • MPZ Agro-Belogore LLC (37 times) – vertically-integrated holding company, which specializes in manufacture of pig meat on a commercial scale and realization of fresh meat products in finished consumer package;
  • Cherkizovsky myasopererabatyvayushchy zavod OJSC (36 times) – today it is one of the largest manufacturers of meat products in Russia. The plant is the main enterprise of meat-processing segment of «Cherkizovo» Group.

The rest participants of TOP-10 list showed the rate of inventory turnover being lower, than the branch average.
According to the independent estimation of the Information agency Credinform, all organizations of the TOP-10 list (except Khalyal Ash LLC - new entrant, producing meat and meat products, which meet Muslim standards for this product) got a high and the highest solvency index, what can signal to potential investors, that the largest market players can pay off their debts in time and fully in the moment of their incurrence.

See also: Product profitability of meat products manufacturers

Herald
Base material sector remains the key one in the economy

The cumulative turnover of 50 the largest companies increased in 2013 by 16,15% in comparison with the year 2012 and made 30 081 bln RUB. By that 56,3% of the total turnover of the TOP-50 enterprises is accounted for by organizations of the base material sector.

According to the results of the year 2013, the largest volume of revenue was represented by two base material giants - Gazprom OJSC and NK Rosneft OJSC. By that NK Rosneft OJSC showed the maximum revenue gain in comparison with the year 2012 among TOP-10 enterprises. Such impressive results of the previous year companies’ representatives associate with the enhancement of efficiency of geological exploration, as well as with the increase of control over operating costs. So that at year-end 2013 the operating costs on extraction made 156,76 RUB/barrels (the ruble-dollar rate as of the end of the year 2013), what is the best specific indicator among public oil companies in the world.

turnover of the largest Russian companies

Picture 1. Dynamics of the turnover of the largest Russian companies, TOP-10

The largest slowdown in the volume of revenue at year-end 2013 among the first ten companies is showed by Kredit Sviss Sekyuritiz LLC (Moscow). At year-end 2013 the company’s turnover made 983 bln RUB, what is by 12,34% less, than for the similar period of the previous year. The enterprise is a part of Swiss financial conglomerate and carries out brokerage and dealer activity on the territory of Russia.

Speaking about branch differentiation, it should be noted, that more than half of the total turnover of TOP-50 is accounted for by enterprises of the base material sector (56,3%), then follow: companies engaged in financial intermediation (24,73%) and representatives of retailers (5,88%).

branch differentiation

Picture 2. Branch differentiation

At year-end 2013 the total net profit (taken into account the loss) of 50 the largest Russian companies on turnover made 2248 bln RUB, among them 79% are accounted for by 10 the largest enterprises on the net profit volume. By that 9 from 10 firms relate to the base material sector of the economy.

Gorno-metallurgicheskaya kompaniya Norilsky nikel OJSC is the only one metals company got shortlisted in TOP-10 on the amount of net profit. Following the results of the year 2013, company’s net profit made 78 305 mln RUB, what is by 12% higher, than in the similar period of the year 2012, i.e. the growth lags behind inflationary changes. However, the enterprise succeeded in cutting of capital expenditure by 27% in the previous year.

Table 1. Net profit/loss of the largest companies in Russia, TOP-10
Name, INNActivityNet profit/loss for 2013, in mln RUBTurnover for 2013, in mln RUBSolvency index GLOBAS-i® 
1 Gazprom OJSC
INN 7736050003
Base material sector 628 311 3 933 335 164 (the highest)
2 Surgutneftegaz OJSC
INN 8602060555
Base material sector 256 517 814 188 166 (the highest)
3 Neftyanaya kompaniya Lukoil OJSC
INN 7708004767
Base material sector 209 871 260 009 151 (the highest)
4 Rosneftegaz OJSC
INN 7705630445
Base material sector 160 947 254 512 164 (the highest)
5 Neftyanaya kompaniya Rosneft OJSC
INN 7706107510
Base material sector 136 279 3 544 443 224 (high)
6 Lukoil-zapadnaya Sibir LLC ООО
INN 8608048498
Base material sector 89 371 631 010 200 (high)
7 Gorno-metallurgicheskaya kompaniya Norilsky nikel OJSC
INN 8401005730
Metals industry 78 305 272 585 172 (the highest)
8 Novatek OJSC
INN 6316031581
Base material sector 72 259 245 077 167 (the highest)
9 Orenburgneft OJSC
INN 5612002469
Base material sector 69 476 299 511 218 (high)
10 Aktsionernaya neftyanaya kompaniya Bashneft OJSC
INN 0274051582
Base material sector 69 124 517 487 206 (high)

The total amount of assets of TOP-50 Russian companies made 38 333 mln RUB at year-end 2013. RZHD OJSC is among leaders on the amount of assets, 12% of total volume of assets of 50 the largest enterprises of the country are accounted for by this organization.

Table 2. Assets of the largest companies in Russia, TOP-10  
Name, INNActivityAssets for 2013, in mln RUBTurnover for 2013, in mln RUBSolvency index GLOBAS-i® 
1 Gazprom OJSC
INN 7736050003
Base material sector 10 848 419 3 933 335 164 (the highest)
2 Neftyanaya kompaniya Rosneft OJSC
INN 7706107510
Base material sector 4 980 147 3 544 443 224 (high)
3 Rossijskie zheleznye dorogi OJSC
INN 7708503727
Transport 4 577 538 1 376 582 235 (high)
4 Rosneftegaz OJSC
INN 7705630445
Base material sector 2 550 432 254 512 164 (the highest)
5 Surgutneftegaz OJSC
INN 8602060555
Base material sector 2 105 126 814 188 166 (the highest)
6 Neftyanaya kompaniya Lukoil OJSC
INN 7708004767
Base material sector 1 296 276 260 009 151 (the highest)
7 Rossijsky kontsern po proizvodstvy elektricheskoy I teplovoy energii na atomnykh stantsiyakh OJSC
INN 7721632827
Energy industry 1 240 961 232 857 211 (high)
8 Aktsionernaya kompaniya po transportu nefti Transneft OJSC
INN 7706061801
Base material sector 930 257 704 714 159 (the highest)
9 Gazprom neft OJSC
INN 5504036333
Base material sector 899 540 1 178 064 200 (the highest)
10 Gorno-metallurgicheskaya kompaniya Norilsky nikel OJSC
INN 8401005730
Metals industry 678 532 272 585 172 (high)

All companies under review got a high and the highest solvency index GLOBAS-i®, what characterizes them as financially stable. 

The results of this investigation confirm the thesis about weak diversification of Russian economy and its raw-material orientation. Such trend can be very dangerous, especially in view of falling prices for energy carriers. However, at year-end 2013 the share of extraction of minerals in country’s GDP reduced only by 0,05%, during the share of manufacturing increased by 0,1%.

Appeared complexity in interrelationship with Western governments in view of Ukrainian crisis and introduced sanctions, create new impulses for solution of these problems. So that at the meeting with young academics in Saratov the President of the RF Vladimir Putin noticed, that western sanctions are the motivation for diversification of country’s economy and for development of non-resource sector of the economy.

Aimed at the support of economic growth and development of economy sectors of highest priority, the government approved the program of the support of investment projects, running in Russia on the basis of project financing. Within created mechanism it is planned to grant credits in the volume up to 500 bln RUB on an accrual basis at year-end 2018. Thereby state guarantees in the volume up to 125 bln RUB will be provided on credits.

Along with that many experts assign an important part in the support of economic growth to representatives of small and medium business, for whom tax holidays will come into force starting next year. However, tax privileges extend only to new enterprises of small and medium business.