
Order a report
Custom-made industry research, company ratings, competitor analysis


Trading in electricity – a new type of licensed activity
The Federal Law №451-FZ «On amendments to the Federal Law «On electric power industry» and certain legislative acts of the Russian Federation related to the licensing of power supply activity» dated December 29, 2017 has established that power supply activity after December 30, 2018 can be carried out only on the basis of licenses issued in accordance with this Federal Law and the Regulation on the licensing of power supply activity approved by the Government of the RF.
The law defines power supply activity as the sale of electricity (purchased or produced) in retail markets as well within the Unified Energy System of Russia (UES of Russia) as in territories where technologically there is no connection with the UES of Russia.
The rules for the licensing of power supply activity are determined by:
- lists of licensing requirements for applicants, of grounds for the decision for refusal to grant a license or for their re-registration, grounds for conducting unscheduled inspections against licensees;
- regulations of the organization of licensing control, of termination of a license, the work of the commission for licensing of power supply activity.
The law establishes the procedure for the creation of a consolidated register of licenses for power supply activity at the federal level. the information from this register should be available to the public and posted on the official Internet resource of the state licensing authority.
For the conducting of power supply activity without a license or with violations of license requirements, as well as for other violations related to the licensing of activities since December 30, 2018, an administrative responsibility has been established.
Power supply companies are obliged to obtain licenses no later than on the 29th of December 2018. Later this term the power supply activity without a license is impossible.
According to the Information and Analytical system Globas, there are about 2 000 companies with the registered main activity «Trading in electricity» in Russia and more than 16 000 firms, which have registered this type of activity among others.
According to the investigation published on the 22nd of February 2013 by the Information agency Credinform «Trends in the field of power supply activity», Mosenergosbyt PJSC – guaranteeing supplier of electric power in the territory of Moscow and Moscow region – became the largest Russian company in terms of revenue in 2016.
Trends among the largest companies of Moscow's real economy
Information agency Credinform represents an overview of trends among the largest companies of Moscow’s real economy.
Enterprises of Moscow’s real economy with the largest volume of annual revenue (TOP-10 and TOP-500) were selected for the analysis, according to the data from the Statistical Register for the latest available periods (for 2015 and 2016). The analysis was made on the basis of the data of the Information and Analytical system Globas.
Net assets
Indicator of real cost of corporate assets, which is annually calculated as the difference between assets of the company and its debt liabilities. If the company’s debts exceed net worth value, net assets indicator is considered negative (insufficiency of property).
| Position in TOP-1000 | Name | Net assets value, mln RUB* | Solvency index Globas | ||
| 2014 | 2015 | 2016 | |||
| 1. | PJSC GAZPROM | 9 089 213 | 9 322 339 | 10 414 000 | 141 Superior |
| 2. | PJSC RUSSIAN RAILWAYS | 3 553 400 | 3 578 080 | 4 237 344 | 179 High |
| 3. | JSC ROSNEFTEGAZ | 2 248 951 | 2 827 708 | 3 196 019 | 286 Medium |
| 4. | PJSC ROSNEFT OIL COMPANY | 1 355 532 | 1 436 002 | 1 534 962 | 188 High |
| 5. | JSC ROSENERGOATOM CONCERN | 1 181 245 | 1 298 091 | 1 389 225 | 166 Superior |
| 996. | JSC SPETSENERGOTRANS | -4 671 | -10 077 | -11 616 | 313 Adequate |
| 997. | PJSC FOREIGN ECONOMIC ASSOCIATION TECHNOPROMEXPORT | 1 169 | -10 290 | -14 934 | 600 Insufficient |
| 998. | JSC GLAVMOSSTROY HOLDING COMPANY | 264 | -4 527 | -21 435 | 550 Insufficient |
| 999. | PJSC YAMAL LNG | -66 437 | -183 259 | -25 754 | 236 Strong |
| 1000. | JSC UNITED CHEMICAL COMPANY URALCHEM | -76 947 | -82 991 | -40 923 | 228 Strong |
*) – indicators of growth or reduction compared to the previous period are marked with green and red in columns 4 and 5 respectively.
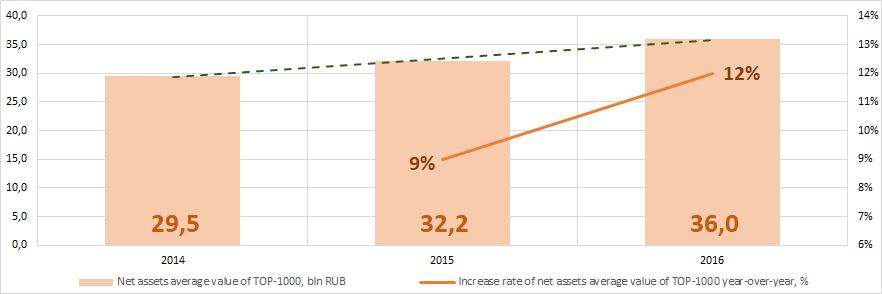 Picture 1. Change in average net assets value of the largest companies of Moscow’s real economy in 2014 – 2016
Sales revenue
The revenue of the largest 10 companies of Moscow’s real economy made 33% of the total revenue of TOP-1000 companies in 2016 (Picture 2).
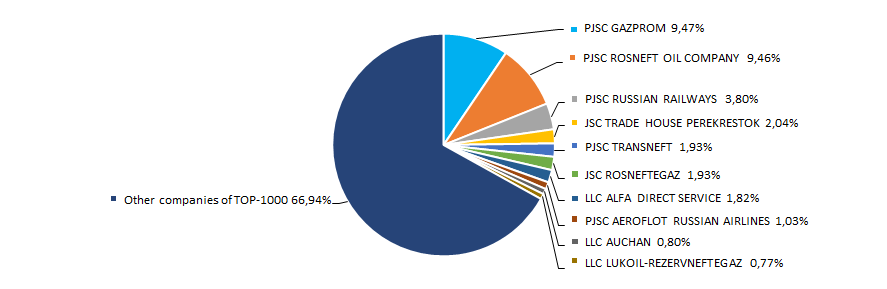 Picture 2. Shares of participation of TOP-10 enterprises in the total revenue of TOP-1000 companies for 2016
Trend to increase in revenue volume is observed (Picture 3).
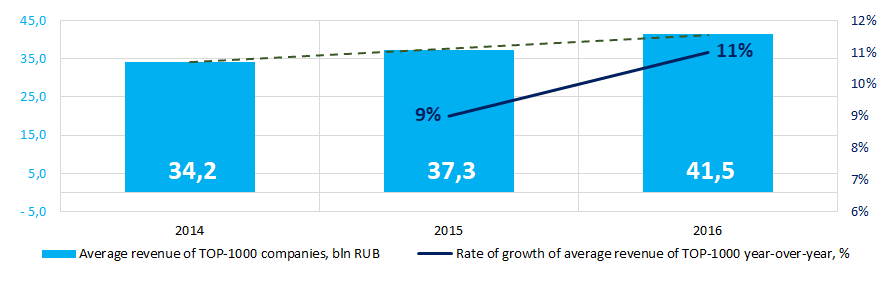 Picture 3. Change in the industry average revenue indicators of companies of Moscow’s real economy in 2014 – 2016
Profit and loss
Profit volume of the largest 10 companies of Moscow’s real economy made 51% of the total profit of TOP-1000 companies in 2016 (Picture 4).
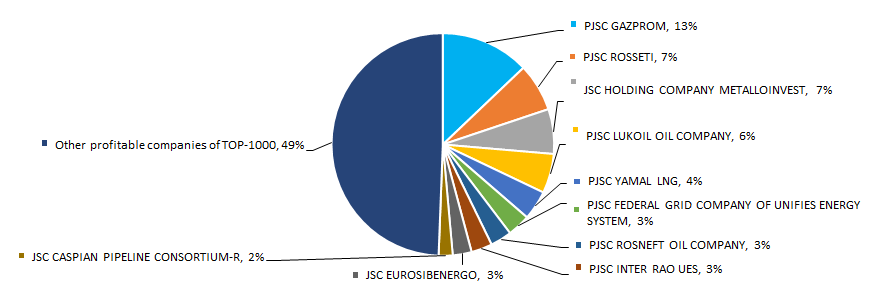 Picture 4. Shares of participation of TOP-10 enterprises in the total profit volume of TOP-1000 companies for 2016
Industry average values of the profit indicators of companies for the three-year period have a trend to increase; average net loss value decreases (Picture 5).
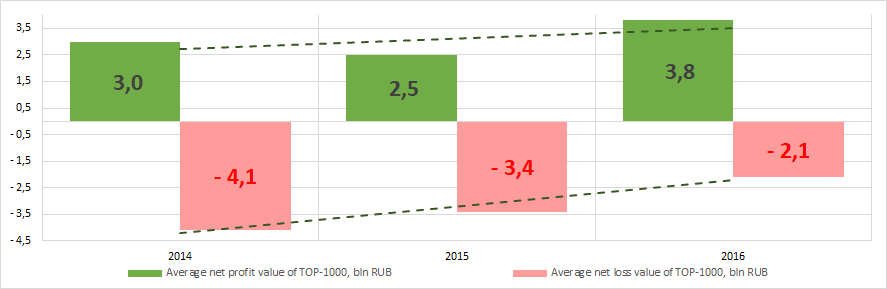 Picture 5. Change in the average profit indicators of the largest companies of Moscow’s real economy in 2014 – 2016
Key financial ratios
Average industry indicator of the total liquidity ratio of TOP-1000 companies in 2014 – 2016 were above or within the recommended values – from 1,0 to 2,0 (Picture 6).
The total liquidity ratio (the relation of the amount of current assets to short-term liabilities) shows the sufficiency of company’s funds for repayment of its short-term liabilities.
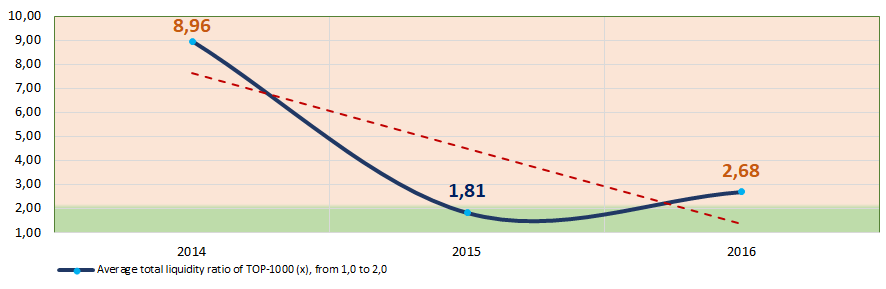 Picture 6. Change in the industry average values of the total liquidity and solvency ratios of the largest companies of Moscow’s real economy in 2014 – 2016
For three years, the instability of return on investment ratiowith trend to increase was observed (Picture 7).
The ratio is calculated as the relation of net profit to the sum of own capital and long-term liabilities and demonstrates the return on the equity involved in the commercial activity and the long-term borrowed funds of an organization.
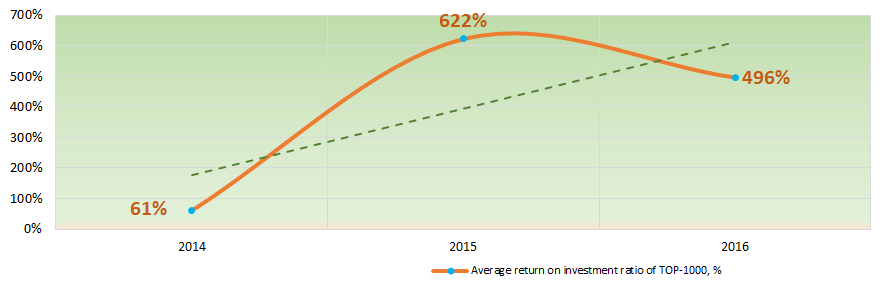 Picture 7. Change in the industry average values of the return on investment of the largest companies of Moscow’s real economy in 2014 – 2016
Asset turnover ratio is calculated as the relation of sales proceeds to the average value of total assets for a period and characterizes the efficiency of use of all available resources, regardless of the sources of their attraction. the coefficient shows how many times a year a complete cycle of production and circulation is made, yielding profit.
For the three-year period, this ratio had a trend to increase (Picture 8).
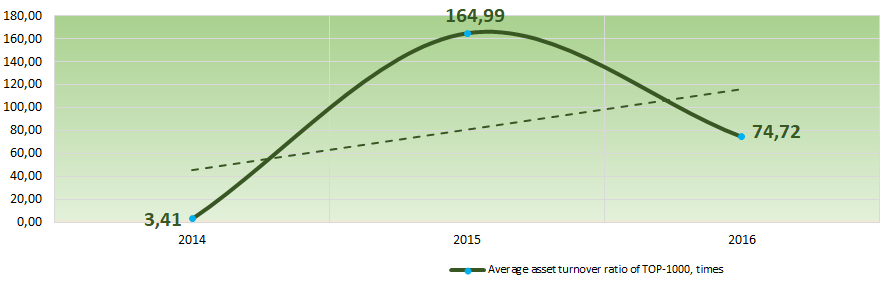 Picture 8. Change in the industry average values of asset turnover ratio of the largest companies of Moscow’s real economy in 2014 – 2016
Production and services structure
Companies engaged in wholesale and oil extraction have the highest share in total revenue among TOP-1000 enterprises (Picture 9).
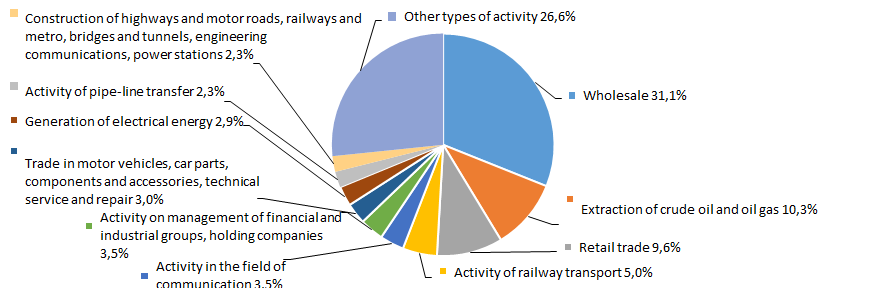 Picture 9. Distribution of types of activity to total revenue of TOP-1000 companies, %
Financial position score
An assessment of the financial position of TOP-1000 companies shows that more than a half of enterprises are in financial situation above average (Picture 10).
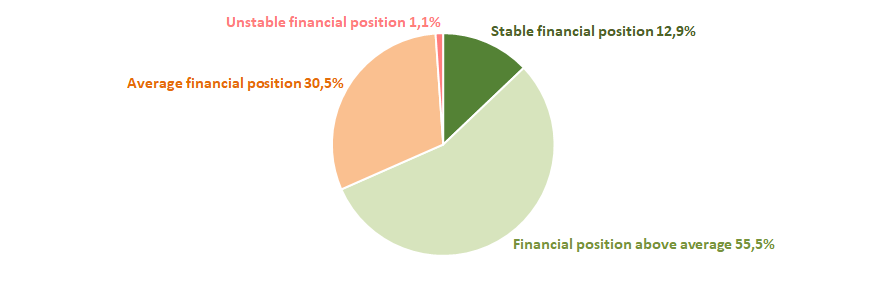 Picture 10. Distribution of TOP-1000 companies by financial position score
Solvency index Globas
The majority of TOP-1000 companies got Superior, High, Strong or Medium Solvency index Globas, that indicates their ability to timely and fully fulfill debt liabilities (Picture 11).
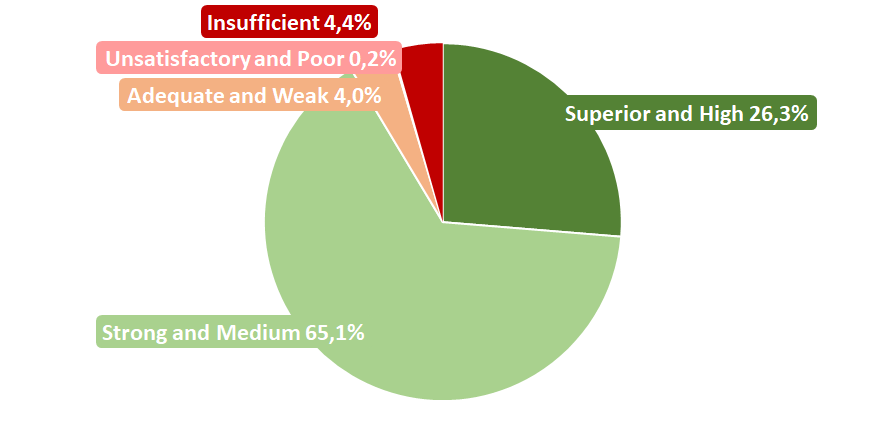 Picture 11. Distribution of TOP-1000 companies by Solvency index Globas
Thus, a comprehensive assessment of the largest companies of Moscow’s real economy, taking into account the main indices, financial indicators and ratios, points to prevalence of favorable trends.