
Order a report
Custom-made industry research, company ratings, competitor analysis


Absolute liquidity of state enterprises
Information agency Credinform represents the ranking of the largest unitary enterprises in Russia. The unitary enterprises (TOP-10) with the largest annual revenue were selected for the ranking, according to the data from the Statistical Register and the Federal Tax Service for the latest available accounting periods (2017 - 2019). Then the enterprises were ranked by the absolute liquidity ratio (Table 1). The analysis was based on the data from the Information and Analytical system Globas.
Absolute liquidity ratio (х) is calculated as a ratio of the amount of cash, being at the disposal of a company, to short-term liabilities.
The ratio determines the share of short-term liabilities, which an enterprise can satisfy in the near future, before satisfying receivables or sale of other assets.
The recommended value is from 0,1 to 0,15. The higher is the indicator, the better is the solvency of an enterprise. However, a too high ratio value might speak of an irrational capital structure and stranded assets in the form of cash and funds on bank accounts, which depreciate and lose their initial liquidity as time passes or as a result of inflation.
In order to get the most comprehensive and fair picture of the financial standing of an enterprise it is necessary to pay attention to all combination of financial indicators and company’s ratios.
| Name, INN, region | Revenue, billion RUB | Net profit (loss), billion RUB | Absolute liquidity ratio (x), from 0,1 to 0,15 | Solvency index Globas | |||
| 2018 | 2019 | 2018 | 2019 | 2018 | 2019 | ||
| 1 | 2 | 3 | 4 | 5 | 6 | 7 | 8 |
| MAIN MILITARY CONSTRUCTION DEPARTMENT FOR SPECIAL OBJECTS INN 7734003657 Amur region,in process of reorganization in the form of transformation since 02.09.2016 |
|
|
|
|
|
|
322 Adequate |
| State Unitary Enterprise Fuel and Energy Complex of St. Petersburg INN 7830001028 Saint Petersburg |
|
|
|
|
|
|
213 Strong |
| State Unitary Enterprise Vodokanal Saint Petersburg INN 7830000426 Saint Petersburg |
|
|
|
|
|
|
206 Strong |
| State Unitary Enterprise Moscow metro INN 7702038150 Moscow |
|
|
|
|
|
|
251 Medium |
| ROSMORPORT INN 7702352454 Moscow |
|
|
|
|
|
|
193 High |
| State Unitary Enterprise Saint Petersburg Metro INN 7830000970 Saint Petersburg |
|
|
|
|
|
|
251 Strong |
| State Unitary Enterprise Mosgortrans INN 7705002602 Moscow |
|
|
|
|
|
|
298 Medium |
| FEDERAL STATE ENTERPRISE SECURITY OF RAILWAY TRANSPORT OF THE RUSSIAN FEDERATION INN 7701330105 Moscow |
|
|
|
|
|
|
233 Strong |
| Federal State-owned Enterprise Russian Television and Radio Broadcasting Network INN 7717127211 Moscow, In process of reorganization by spin-off since 04.07.2016 |
|
|
|
|
|
|
182 High |
| State Federal Unitary Enterprise State ATM Corporation INN 7734135124 Moscow |
|
|
|
|
|
|
182 Superior |
| Average value by TOP-10 companies | |
|
|
|
|
|
|
| Average value by TOP-1000 companies | |
|
|
|
|
|
|
![]() improvement compared to prior period,
improvement compared to prior period, ![]() decline compared to prior period
decline compared to prior period
Average value of absolute liquidity ratio of TOP-10 companies is higher than the average industry one. Only one company has the standard value in 2019.
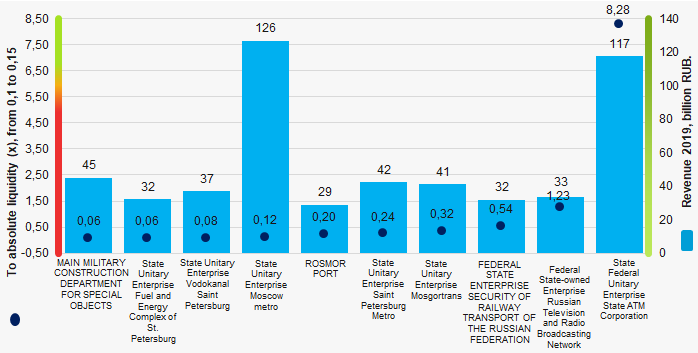 Picture 1. Absolute liquidity ratio and revenue of the largest unitary enterprises (TOP-10)
Within 6 years the average industry values of absolute liquidity ratio TOP-1000 were on the whole beyond the limits of the standard value and tend to improve (Picture 2)
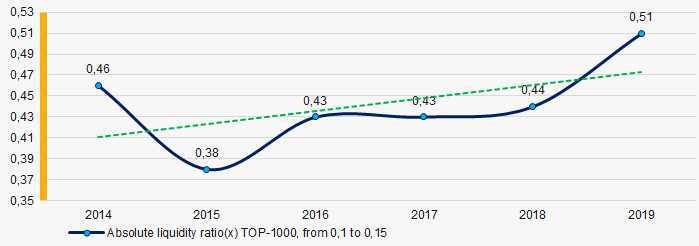 Picture 2. Change of industry average values of absolute liquidity ratio TOP-1000 unitary enterprises in Russia in 2014 – 2019