Over 400 thousand companies have submitted 2020 financial accounts to the Federal Tax Service of Russia. The analysis of 2018 – 2020 revenue and net profit of the largest of them makes it possible to assess their efficiency in 2020. Companies with the largest volume of annual revenue (TOP-10 and TOP-1000) were selected for the ranking, according to the data from the Statistical Register and the Federal Tax Service for the latest available periods (2018 - 2020) (Table 1). The selection and analysis is based on the data of the Information and Analytical system Globas.
For the most complete and objective view of the financial condition of the enterprise, it is necessary to pay attention to the complex of indicators and financial ratios of the company.
Name, INN, region, activity type | Revenue, billion RUB | Net profit (loss), billion RUB | Solvency index Globas | ||||
2018 | 2019 | 2020 | 2018 | 2019 | 2020 | ||
1 | 2 | 3 | 4 | 5 | 6 | 7 | 8 |
JSC ROSNEFT OIL COMPANY INN 7706107510 Moscow Oil extraction |
6 968,2 | ![]() |
![]() |
460,8 | ![]() |
![]() |
209 Strong |
JSC GAZPROM NEFT INN 5504036333 Saint Petersburg Wholesale of solid, liquid and gaseous fuels |
2 070,0 | ![]() |
![]() |
90,2 | ![]() |
![]() |
220 Strong |
JSC MINING AND METALLURGICAL COMPANY NORILSK NICKEL INN 8401005730 Krasnoyarsk territory Production of other non-ferrous metals |
609,1 | ![]() |
![]() |
165,0 | ![]() |
![]() |
185 High |
LLC GAZPROMNEFT-REGIONAL SALES INN 4703105075 Saint Petersburg Wholesale of motor fuel, including aviation gasoline |
661,9 | ![]() |
![]() |
9,4 | ![]() |
![]() |
202 Strong |
JSC SEVERSTAL INN 3528000597 Vologda region Production of cast iron, steel and ferroalloys |
432,8 | ![]() |
![]() |
124,3 | ![]() |
![]() |
222 Strong |
JSC NOVOLIPETSK STEEL MILL INN 4823006703 Lipetsk region Production of cold-rolled steel sheets |
493,8 | ![]() |
![]() |
117,9 | ![]() |
![]() |
237 Strong |
JSC MAGNITOGORSK IRON & STEEL WORKS INN 7414003633 Chelyabinsk region Production of cast iron, steel and ferroalloys |
458,2 | ![]() |
![]() |
73,7 | ![]() |
![]() |
172 Superior |
JSC MOSENERGOSBYT INN 7736520080 Moscow Electricity trade |
351,0 | ![]() |
![]() |
2,3 | ![]() |
![]() |
196 High |
LLC RN-YUGANSKNEFTEGAZ INN 8604035473 Khanty-Mansi autonomous district - Yugra Provision of services in the field of oil and natural gas production |
293,2 | ![]() |
![]() |
1,9 | ![]() |
![]() |
233 Strong |
JSC AERFOLOT – RUSSIAN AIRLINES INN 7712040126 Moscow Transportation by scheduled air passenger transport |
504,7 | ![]() |
![]() |
2,8 | ![]() |
![]() |
284 Medium |
Average value for TOP-10 | 1 284,3 | ![]() |
![]() |
104,8 | ![]() |
![]() |
|
Average value for TOP-1000 | 18,8 | ![]() |
![]() |
1,8 | ![]() |
![]() |
growth of indicator to the previous period,
decrease of indicator to the previous period
The average values of revenue and net profit of TOP-10 companies are much above the average one of TOP-1000. In 2019, four companies have increased their values compared to the previous period.
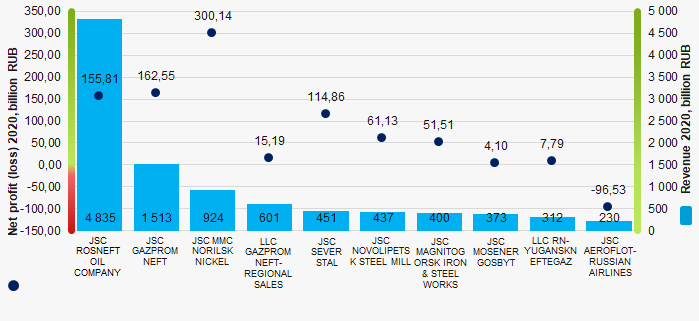
In 2015 – 2018, the revenue of TOP-1000 companies had a trend to increase. In 2019, the zero increase rate was observed, and in 2020, it was the negative one. The 2020 revenue fell 18% (Picture 2).
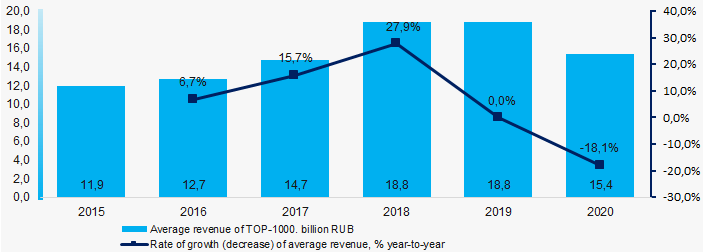
A slight net profit gain among TOP-1000 companies, and diverse growth rate were recorded up to 2019. In 2020, there was almost double fell of the profit compared to the previous period (Picture 3).
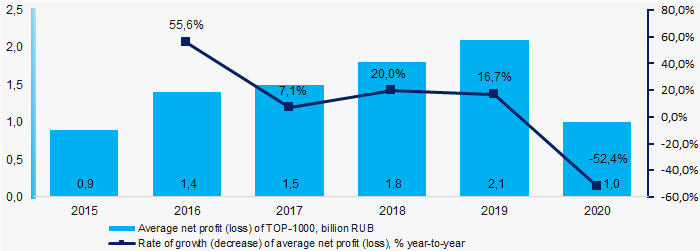
Information agency Credinform represents a ranking of the largest Russian taxpayers.
The largest income tax payers with the highest annual revenue (TOP-1000) were selected for the ranking, according to the data from the Statistical Register and the Federal Tax Service for the latest available periods (2014 - 2019). The selection and analysis of companies were based on the data of the Information and Analytical system Globas.
Net assets are total assets less total liabilities. This indicator reflects the real value of the property of an enterprise. When the company’s debt exceeds the value of its property, the indicator is considered negative (insufficiency of property).
The largest company in term of net assets is JSC ATOMIC ENERGY POWER CORPORATION, INN 7706664260, Moscow, other information technology and computer service activities. In 2019, net assets value of the company almost amounted to 1 352 billion RUB.
The lowest net assets value among TOP-1000 belonged to LLC RN-VOSTOKNEFTEPRODUKT, INN 2723049957, Khabarovsk territory, wholesale of motor-fuel, including aviation fuel. In 2019, insufficiency of property of the legal entity was indicated in negative value of -7,5 billion RUB.
Covering the six-year period, the average net assets values of TOP-100 have a trend to increase with a decreasing growth rate (Picture 1).
Over the past six years, the share of companies with insufficient property had a positive trend to decrease (Picture 2).
Sales revenue
In 2019, the revenue volume of ten largest companies was 42% of total TOP-1000 revenue (Picture 3). This is indicative of a quite high level of aggregation of capital in the examined group of companies.
In general, there is a trend to increase in revenue with the decreasing growth rate (Picture 4).
Profit and loss
The largest organization in term of net profit is JSC NIPIGASPERERABOTKA, INN 2310004087, Tyumen region, development of industrial processes and production project. The company’s profit for 2019 exceeded 11 billion RUB.
Covering the six-year period, there is a trend to decrease in average net profit with the decreasing growth rate (Picture 5).
For the six-year period, the average net profit values of TOP-1000 have the decreasing trend with the increasing net loss (Picture 6).
Key financial ratios
Covering the six-year period, the average values of the current liquidity ratio were much above the recommended one - from 1,0 to 2,0 with a trend to increase (Picture 7).
Current liquidity ratio (current assets to short-term liabilities) shows the sufficiency of company’s assets to repay on short-term liabilities.
Covering the six-year period, the average values of ROI ratio were at the high level with a trend to increase (Picture 8).
ROI ratio is calculated as net profit to sum of shareholders equity and long-term liabilities, and shows the return of equity involved in commercial activities and long-term borrowed funds.
Assets turnover ratio is the ratio of sales revenue and company’s average total assets for a period. It characterizes the effectiveness of using of all available resources, regardless the source of their attraction. The ratio shows how many times per year the full cycle of production and circulation is performed, generating the corresponding effect in the form of profit.
Covering the six-year period, business activity ratio demonstrated the increasing trend (Picture 9).
Small business
66% of companies included in TOP-1000 are registered in the Register of small and medium-sized enterprises of the Federal Tax Service of the Russian Federation. Their share in total revenue of TOP-1000 is 5,5% that is much lower than the average country values (Picture 10).
Main regions of activity
Companies of TOP-1000 are registered in 65 regions of Russia, and unequally located across the country. Over 54% of companies largest by revenue are located in Moscow and Saint Petersburg (Picture 11).
Financial position score
Assessment of the financial position of TOP-1000 companies shows that the majority of them have financial position above average (Picture 11).
Solvency index Globas
Most of TOP-1000 companies got Superior / High and Strong / Medium indexes Globas. This fact shows their limited ability to meet their obligations fully (Picture 13).
Conclusion
Complex assessment of activity of the largest taxpayers, taking into account the main indexes, financial ratios and indicators, demonstrates the prevalence of negative trends in 2014 - 2019 (Table 1).
Trends and evaluation factors | Relative share of factors, % |
Dynamics of the average net assets value | ![]() |
Rate of growth (decrease) in the average size of net assets | ![]() |
Increase (decrease) in the share of enterprises with negative values of net assets | ![]() |
Level of competition / monopolization | ![]() |
Dynamics of the average revenue | ![]() |
Rate of growth (decrease) in the average size of revenue | ![]() |
Dynamics of the average profit (loss) | ![]() |
Rate of growth (decrease) in the average profit (loss) | ![]() |
Growth / decline in average values of companies’ net profit | ![]() |
Growth / decline in average values of companies’ net loss | ![]() |
Increase / decrease in average values of total liquidity ratio | ![]() |
Increase / decrease in average values of return on investment ratio | ![]() |
Increase / decrease in average values of asset turnover ratio, times | ![]() |
Share of small and medium-sized businesses in terms of revenue being more than 22% | ![]() |
Regional concentration | ![]() |
Financial position (the largest share) | ![]() |
Solvency index Globas (the largest share) | ![]() |
Average value of factors | ![]() |
positive trend (factor),
negative trend (factor)