Order a report
Custom-made industry research, company ratings, competitor analysis


The debt ratio of the largest Russian investment companies
Information Agency Credinform has prepared the ranking of the largest Russian investment companies. The largest enterprises of the industry (TOP-10) in terms of revenue were selected according to the data from the Statistical Register for the latest available periods (2015 and 2014). Then the companies were ranged by the debt ratio (Table 1).
Debt ratio (or the debt to assets ratio) is one of the financial stability ratios. The ratios of this group determine the possibility of granting the long-term loans or investing as they characterize the possibility of the company to meet its long-term obligations. The debt ratio is calculated as a ratio of total borrowed funds to equity capital and shows how many units of borrowed funds the company had attracted to each unit of own sources of financing.
The recommended value of the ratio is less than 1. The debt to assets ratio should not be negative, therefore the ratio value from 0 to 1 is one of the indicators of company’s high ability to meet its obligations.
The calculation of practical values of financial indicators, which might be considered as normal for a certain industry, has been developed and implemented in the Information and Analytical system Globas-i® by the experts of Information Agency Credinform, taking into account the actual situation of the economy as a whole and the industries. The practical value of debt ratio for investment companies is from 0 to 0,77.
For the most full and fair opinion about the company’s financial position not only the compliance with standard values, but the whole set of financial indicators and ratios should be taken into account.
| Name, INN, region | 2015 net profit, mln RUB | 2015 revenue, mln RUB | 2015/2014 revenue, +/- % | Debt ratio, (х) | Solvency index Globas-i® |
|---|---|---|---|---|---|
| Investment Company Freedom Finance LLC INN 7705934210 Moscow |
193,0 | 115 186,1 | 64 | 0,12 | 217 High |
| NAO OLMA INVESTMENT FIRM INN 7711056412 Moscow |
-30,3 | 161 131,1 | 21 | 0,40 | 246 High |
| LLC CREDIT SUISSE SECURITIES (MOSCOW) INN 7705183980 Moscow |
675,4 | 718 345,2 | -6 | 1,06 | 255 High |
| RENAISSANCE BROKER LIMITED INN 7709258228 Moscow |
562,5 | 234 829,2 | -5 | 1,46 | 226 High |
| VTB CAPITAL BROKER LIMITED INN 7702668793 Moscow |
50,6 | 116 017,6 | 139 | 2,03 | 256 High |
| NAO SOLID Investment Financial Company INN 5008009854 Moscow |
35,5 | 99 538,0 | -61 | 6,29 | 272 High |
| LLC ATON INN 7702015515 Moscow |
19,7 | 106 618,9 | 102 | 7,68 | 228 High |
| REGION BROKER COMPANY LLC INN 7708207809 Moscow |
1 040,7 | 279 897,4 | -13 | 19,09 | 217 High |
| NAO KIT FINANCE INN 7840060671 Saint-Petersburg |
376,3 | 336 873,6 | 39 | 21,30 | 227 High |
| NAO Investment Company AK BARS FINANCE INN 7706537061 Moscow |
111,7 | 108 370,1 | 8236 | 76,26 | 234 High |
| Total for TOP-10 group of companies | 3 035,2 | 2 276 807,3 | 7* | 13,57* | |
| Total for TOP-100 group of companies | 11 503,7 | 2 872 517,0 | -17* | -63,16* |
*) - average value within group of companies
In 2015 the average value of debt ratio within TOP-10 group of companies is much higher than average value within TOP-100 group of companies, which has negative value. Meanwhile only two companies, which take first two places of the ranking, have the ratio within recommended and practical values. In 2015 the industry average value amounted to 0,09.
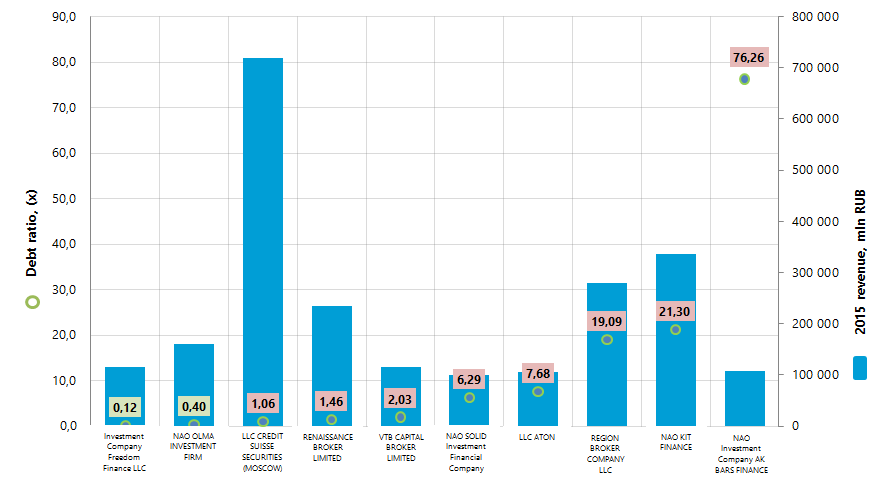
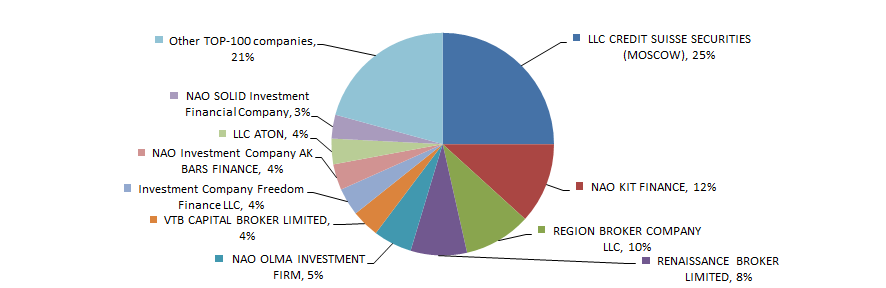
Total revenue of 10 largest companies amounted to 79% from TOP-100 total revenue. This fact testifies the high level of monopolization within industry. Thus, the share of the largest company by 2015 total revenue - LLC CREDIT SUISSE SECURITIES (MOSCOW) in TOP-10 total revenue amounted to more than 31% (Picture 2).
All companies from TOP-10 list have high solvency index Globas-i®, this fact shows the ability of the companies to meet their obligations in time and fully.
Five companies from TOP-10 list (red color in Table 1) have loss or decrease in net profit or decrease in 2015 revenue in comparison with previous period.
In general the investment activity ratios are not sustainable over the last few years; this testifies the estimated data from the Federal State Statistics Service (Picture 3, Table 2).
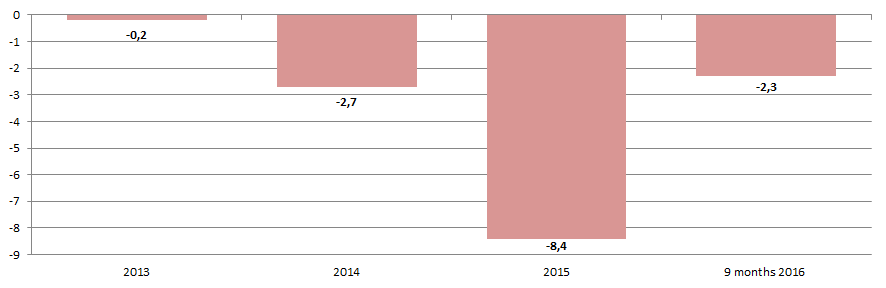
(The index of physical volume is the ratio of investment volume into fixed capital for the current period to the base period. The ratio is calculated within comparable prices.)
The raised funds as the source of investment into fixed capital amounted to approximately 50% (Table 2).
| 2013 | 2014 | 2015 | 9 months 2016 | |
|---|---|---|---|---|
| borrowed funds of other companies | 6,3 | 6,4 | 5,7 | 6,4 |
| foreign investment | n/a | 0,8 | 0,9 | 0,7 |
| bank credits | 9,6 | 9,3 | 7,8 | 10,6 |
| the credits from foreign banks | 0,9 | 1,1 | 1,9 | 2,7 |
| raised funds | 52,5 | 51,9 | 48,8 | 46,4 |
*) Red color in table 2 shows decrease of the share in comparison with previous period, green color shows the growth.
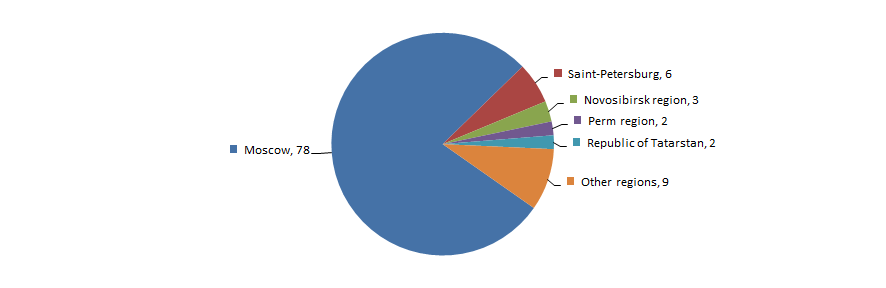
Investment companies are unequally distributed across the country and concentrated in Moscow – the largest financial center of the country. This fact is confirmed by data from the Information and Analytical system Globas-i, according to which 100 largest companies of the industry in terms of 2015 revenue are registered in 14 Russian regions (Picture 4).