
Order a report
Custom-made industry research, company ratings, competitor analysis


Trends in tourism
Information agency Credinform has prepared a review of trends in tourism. The largest Russian travel agencies (TOP-10 and TOP-1000) in terms of annual revenue were selected according to the data from the Statistical Register for the latest available periods (2015 - 2017). The analysis was based on data of the Information and Analytical system Globas.
Net assets is a ratio reflecting the real value of company's property. It is calculated annually as the difference between assets on the enterprise balance and its debt obligations. The ratio is considered negative (insufficiency of property), if company’s debt exceeds the value of its property.
| № | Name, INN, region | Net assets value, bln RUB | Solvency index Globas | ||
| 2015 | 2016 | 2017 | |||
| 1 | 2 | 3 | 4 | 5 | 6 |
| 1 | JSC TOURIST COMPLEX KLJASMA LAKE INN 5029026466 Moscow region |
5,48 | |
|
212 Strong |
| 2 | ПVAO INTOURIST INN 7703016416 Moscow |
4,62 | |
|
310 Adequate |
| 3 | LLC VODOHOD INN 7707511820 Moscow |
1,83 | |
|
192 High |
| 4 | LLC LITEINYI 5 INN 7838397950 Saint Petersburg |
1,06 | |
|
175 High |
| 5 | LLC KEYSUSTEMS TOUR INN 2130119586 Chuvash Republic |
1,06 | |
|
241 Strong |
| 996 | LLC SVOY TOUR AND TRAVEL INN 7730633954 Moscow |
-0,14 | |
|
290 Medium |
| 997 | LLC VEGA INN 0256021810 Republic of Bashkortostan |
-0,11 | |
|
367 Adequate |
| 998 | LLC HOTEL AND TOURIST COMPLEX LADOGA ESTATE INN 1007021940 Republic of Karelia |
-0,10 | |
|
349 Adequate |
| 999 | LLC NTC INTOURIST INN 7717678890 Moscow |
-0,08 | |
|
315 Adequate |
| 1000 | LLC TT-TRAVEL INN 7714775020 Moscow |
-4,34 | |
|
306 Adequate |
![]() — growth indicator in comparison with prior period,
— growth indicator in comparison with prior period, ![]() — decline indicator in comparison with prior period.
— decline indicator in comparison with prior period.
For the last ten years, the average values of TOP-1000 net assets showed the decreasing tendency (Picture 1).
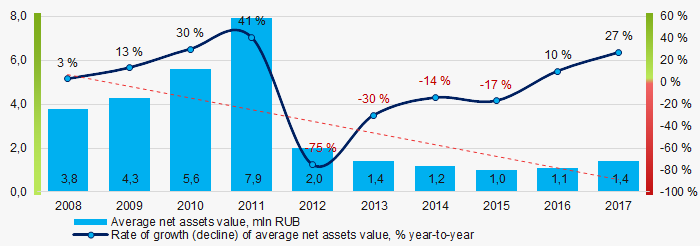 Picture 1. Change in average net assets value of travel agencies in 2008 – 2017
For the last three years, the share of enterprises with lack of property is decreasing (Picture 2).
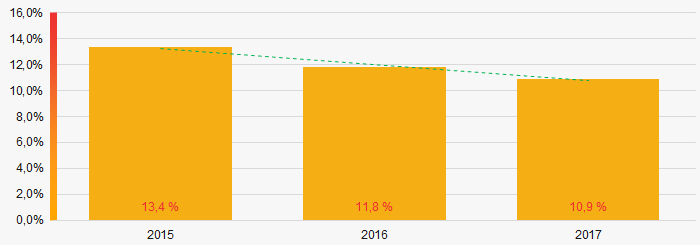 Picture 2. The share of enterprises with negative net assets value in ТОP-1000 in 2015 – 2017
 Sales revenue
In 2017, the total revenue of 10 largest companies amounted to 24% from ТОP-1000 total revenue (Picture 3). This fact testifies high level of competition within the industry.
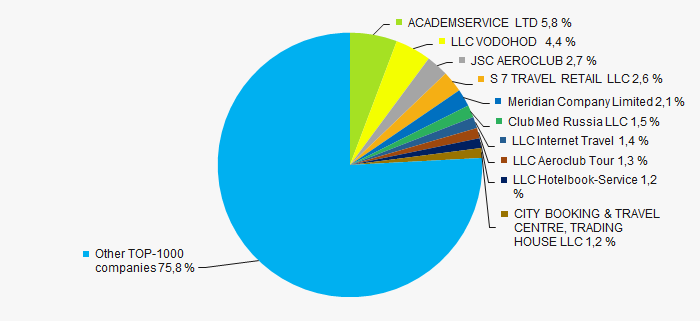 Picture 3. Shares of TOP-10 in TOP-1000 total revenue for 2017
In general, over a ten-year period the decrease in average sales revenue is observed (Picture 4).
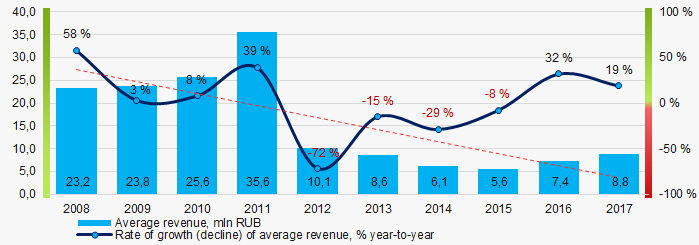 Picture 4. Change in average revenue of travel agencies in 2008 – 2017
Profit and loss
In 2017 profit of 10 largest companies amounted to 27% from TOP-1000 total profit (Picture 5).
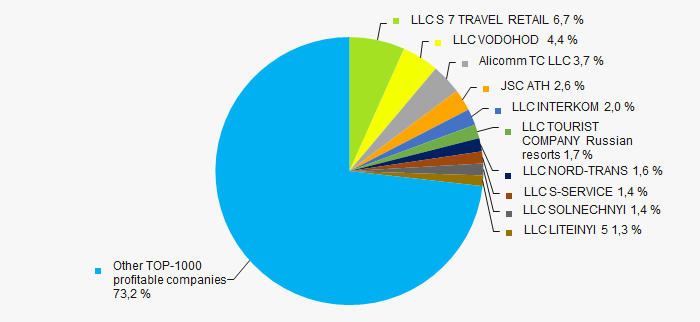 Picture 5. Shares of TOP-10 companies in TOP-1000 total profit for 2017
For the last ten years, the average net profit values show the growing tendency (Picture 6).
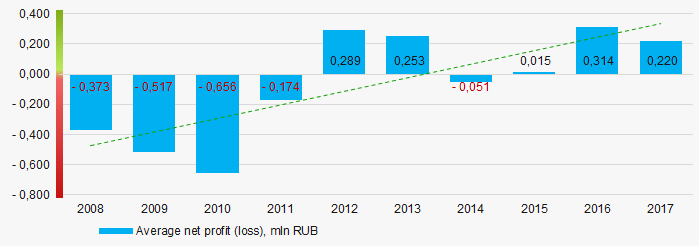 Picture 6. Change in average net profit of travel agencies in 2008 – 2017
Over a three-year period, the average net profit values of ТОP-1000 show the growing tendency, along with this the average net loss decreases (Picture 6).
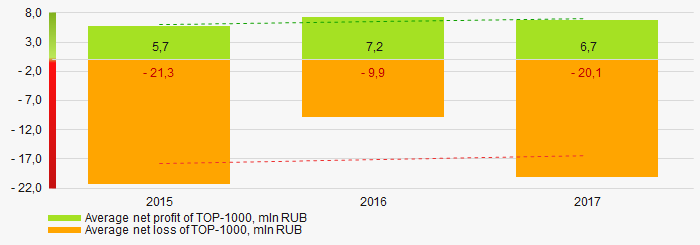 Picture 7. Change in average profit/loss of ТОP-1000 companies in 2015 – 2017
 Main financial ratios
For the last ten years, the average values of the current liquidity ratio were within the recommended values - from 1,0 to 2,0, with growing tendency (Picture 8).
The current liquidity ratio (ratio of total working capital to short-term liabilities) shows the sufficiency of company’s assets to meet short-term obligations.
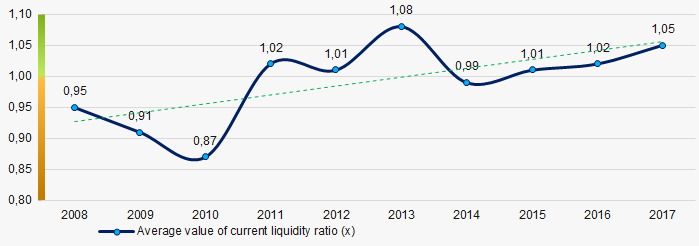 Picture 8. Change in average values of current liquidity ratio of travel agencies in 2008 – 2017
 For the last ten years, the average values of ROI ratiowere mostly negative with growing tendency (Picture 9).
The ROI ratio is calculated as a ratio of net profit to sum of stockholder equity and long-term liabilities and shows the return from equity involved in commercial activities and long-term borrowed funds.
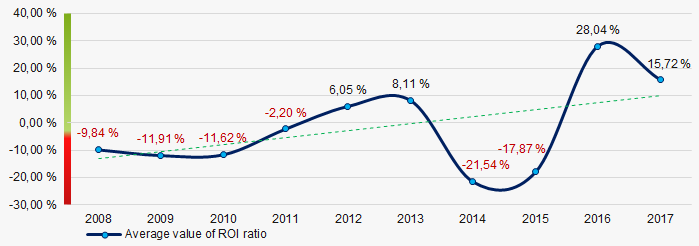 Picture 9. Change in average values of ROI ratio in 2008 – 2017
Assets turnover ratio is the ratio of sales revenue and company’s average total assets for a period. It characterizes the effectiveness of using of all available resources, regardless the source of their attraction. The ratio shows how many times per year the full cycle of production and circulation is performed, generating the corresponding effect in the form of profit.
For the last ten years, this business activity ratio demonstrated the downward trend (Picture 10).
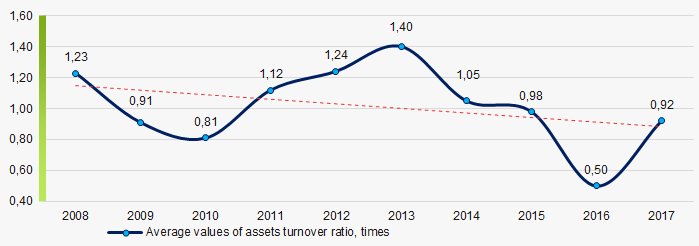 Picture 10. Change in average values of assets turnover ratio of travel agencies in 2008 – 2017
 Production structure
The largest share of ТОP-1000 total revenue is occupied by the enterprises engaged in travel agency services (Picture 11).
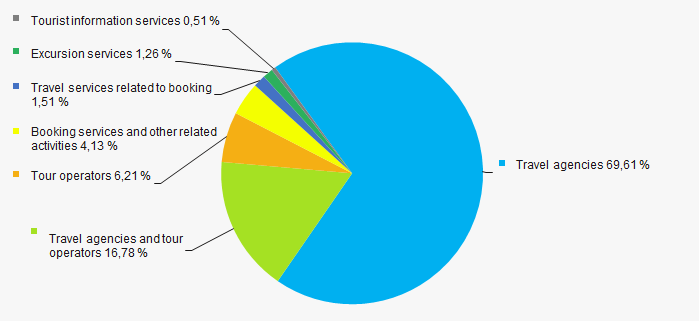 Picture 11. Distribution of activities in ТОP-1000 total revenue
94% of ТОP-1000 companies are registered in the Unified register of small and medium-sized enterprises of the Russian Federal Tax Service. Herein, in 2017 their share in TOP-1000 total revenue amounted to 68%, it is significantly higher than indicator for the economy as a whole (Picture 12).
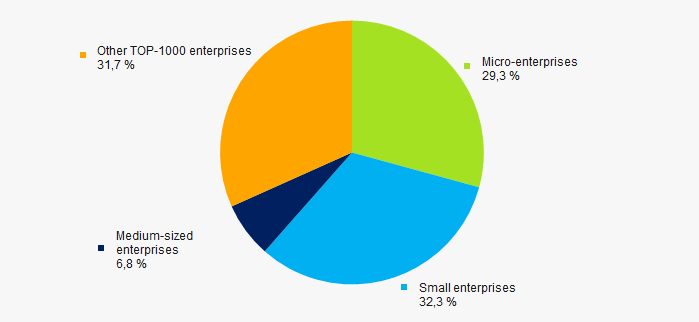 Picture 12. Shares of small and medium-sized enterprises in ТОP-1000, %
Main regions of activity
ТОP-1000 companies are unequally located across the country and registered in 70 regions of Russia. More than 76% of the largest enterprises in terms of revenue are located in Moscow, Moscow region and Saint Petersburg Picture 13).
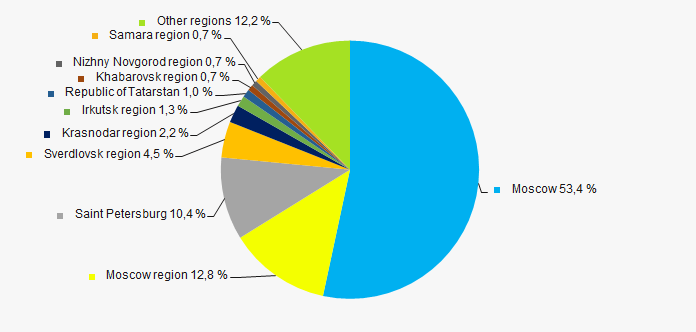 Picture 13. Distribution of TOP-1000 revenue by the regions of Russia
Financial position score
An assessment of the financial position of TOP-1000 companies shows that more than a half of them have stable or above average financial position (Picture 14).
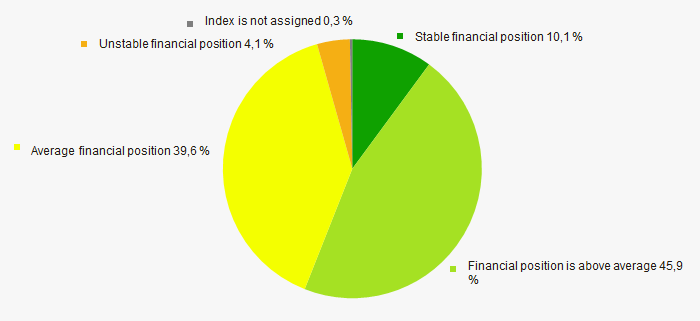 Picture 14. Distribution of TOP-1000 companies by financial position score
Solvency index Globas
Most of TOP-1000 companies got superior/high or strong/medium Solvency index Globas, this fact shows the ability of the companies to meet their obligations in time and fully (Picture 15).
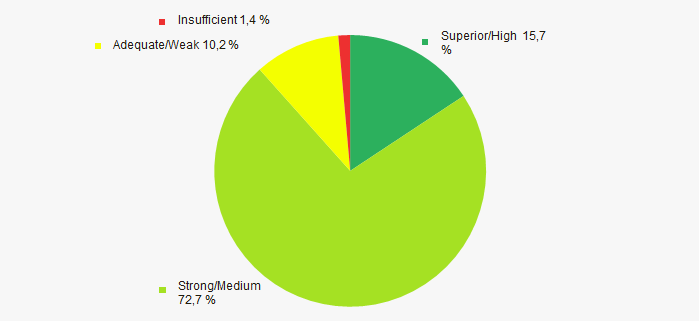 Picture 15. Distribution of TOP-1000 companies by Solvency index Globas
 Conclusion
A complex assessment of activity of the largest Russian travel agencies, taking into account the main indexes, financial ratios and indicators, demonstrates the presence of favorable trends (Table 2).
| Trends and assessment factors | Relative share, % |
| Growth/drawdown rate of average net assets value | |
| Increase / decrease in the share of enterprises with negative net assets | |
| Growth/drawdown rate of average revenue | |
| Competition/ monopolization level | |
| Growth/drawdown rate of average net profit (loss) | |
| Increase / decrease in average net profit of TOP-1000 companies | |
| Increase / decrease in average net loss of TOP-1000 companies | |
| Increase / decrease in average values of current liquidity ratio | |
| Increase / decrease in average values of ROI ratio | |
| Increase / decrease in average values of assets turnover ratio, times | |
| Share of small and medium-sized businesses in the industry by revenue more than 30% | |
| Regional concentration | |
| Financial position (the largest share) | |
| Solvency index Globas (the largest share) | |
| Average value of factors | |
![]() — favorable trend (factor),
— favorable trend (factor), ![]() — unfavorable trend (factor).
— unfavorable trend (factor).