Redomicilation to Russia
The law on termination of the double tax treaty between Russia and the Netherlands was signed on May 26, 2021 due to the refusal of the Netherlands government to rise tax rate to 15% for dividends and interest transferred from the Russian subsidiaries to foreign accounts. The treaty will be no longer in force from January 1, 2022, if the notice of denunciation is sent before the end of June 2021.
Cyprus, Malta and Luxembourg have agreed to change the doubly tax treaty on such conditions as Russia established.
Russian companies controlled by the foreign residents
The residents of four countries, the treaty is revised with, control 7 448 Russian legal entities including 337 the largest taxpayers with the annual revenue exceeding 10 billion RUB.
The Cyprus residents control 5 898 companies including 218 the largest taxpayers, and 1 204 entities with 104 the largest taxpayers count for the Netherlands.

Consequences of termination of the double tax treaty with the Netherlands
The double tax treaty with the Netherlands made it possible to withdraw profit from Russia in the form of dividends at the 5% rate, and interest on debenture at the 0% rate. In 2019, 339,9 billion RUB were transferred to the Netherlands in this way. According to the Central bank of Russia, the volume of foreign direct investment in the reinvestment of income from the Netherlands to Russia amounted to 118,6 billion RUB, i.e. 2,9 times less than the withdrawn capital.

Now the rate will be risen to 15% for dividends and to 20% for interest. If a legal entity operates without a permanent establishment, it will be obliged to pay the income tax in two jurisdictions. Moreover, such kind of companies cannot count on the reduction of rates in Netherlands at the distribution of interest and dividends in Russia. Taxes paid in the Netherlands will not be counted for individuals either.
It will be a milestone for the Russian business: it is head for the foreign corporations obtaining profit in Russia to pay taxes at the full rates especially in light of the fact that many of them are of the Russian origin.
The largest taxpayers controlled by the Dutch legal entities:
JSC VIMPEL-COMMUNICATIONS, JSC AVTOVAZ, LLC YANDEX,
JSC FORTUM, LLC CORPORATE CENTER X 5,
JSC TRANSMASHHOLDING, LLC URAL LOCOMOTIVES
Consequences of changes of the double tax treaty with Cyprus
Formally not considered as an offshore zone, Cyprus with its very loyal tax legislation was the most attractive country for large companies of the Russian origin until recently. Over 1,9 trillion RUB were transferred to Cyprus in 2019, while the foreign direct investment in the reinvestment of income from Cyprus to Russia were 3,7 times less and amounted to 512 billion RUB.

A new treaty with Cyprus is already in force since January 1, 2021. The tax rate for dividends was increased form 5% to 15% and for interest – from 0% to 15%. After applied changes, there is the first case of redomicilation. On March 2021, LENTA INTERNATIONAL PUBLIC JOINT-STOCK COMPANY was redomiciled from Cyprus to the special administrative region in Kaliningrad, the major shareholder of LLC LENTA-2, owner of Lenta hypermarket chain.
Special administrative regions or SAR are regions with preferential tax regime located in the islands Russky (Vladivostok) and Oktyabrsky (Kaliningrad). The main purpose of SAR establishment is the repatriation of capital and protection of legal entities from sanctions.
The largest taxpayers controlled by the Cyprus residents are engaged in the metallurgical industry:
JSC NOVOLIPETSK STEEL MILL, JSC MAGNITOGORSK IRON & STEEL WORKS,
JSC PIPE METALLURGICAL COMPANY
Harbors for the Russian business
The Ministry of Finance of Russia plans to start negotiations with Singapore, Switzerland and Hong Kong for changes in double tax treaty. The possible strategy for the holding companies is to have no foreign residents as shareholders, which will lead to reorganization of their corporate structure. Special administrative regions in Vladivostok and Kaliningrad may provide an alternative where there is a 5% tax rate for dividends for public international holding companies (“public IHC”). Moreover, there is a bill on application of this regime for non-public IHC.
The following shareholders of large corporations were established in SAR:
LENTA INTERNATIONAL PUBLIC JOINT-STOCK COMPANY,
OK RUSAL INTERNATIONAL PUBLIC JOINT-STOCK COMPANY,
EN+ GROUP INTERNATIONAL PUBLIC JOINT-STOCK COMPANY,
ROSENERGO INVESTMENTS INTERNATIONAL PUBLIC JOINT-STOCK COMPANY,
INTERNATIONAL COMPANY AKTIVUM shareholder of JSC MMC NORILSK NICKEL)
The creation of special administrative regions is the transfer of international practices of offshore administration to Russia. In the future, this will make it possible not only to re-domicile Russian companies, but also to attract foreign ones. Subject to the revision of the treaties under the terms of Russia, the rate on dividends and interest in foreign jurisdictions will be increased to 15%, and it will be 0-5% in domestic offshores.
Activity trends in shipbuilding
Information agency Credinform presents an overview of trends in shipbuilding industry.
The largest companies in the industry (TOP-100) in terms of annual revenue for the last reporting periods available to the state statistics bodies and the Federal Tax Service (2016-2020) were selected for the analysis. Selection and analysis of companies were carried out based on data from the Information and Analytical system Globas.
Net assets – is a ratio that reflects the real value of company's property that is calculated annually as difference between assets on company's balance sheet and its debt obligations. The net asset ratio is negative (insufficient property) when company's debt exceeds value of its property.
The largest company in the industry in terms of net assets is UNITED SHIPBUILDING CORPORATION JSC, INN 7838395215, Saint Petersburg. In 2020 net assets amounted to more than 301 billion rubles.
The smallest amount of net assets in the TOP-100 was owned by BALTIC SHIPYARD JSC, INN 7830001910, Saint Petersburg. Insufficiency of property in 2020 was expressed by a negative value of -9.7 billion rubles.
During the five-year period, average net assets of the TOP-100 tend to increase with positive growth rates (Picture 1).
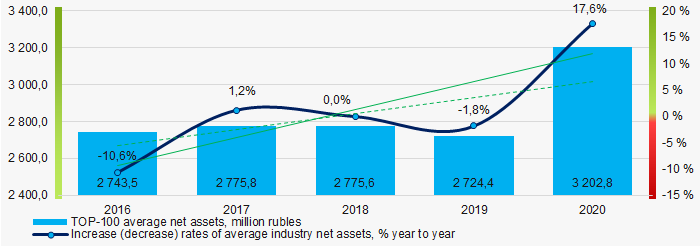 Picture 1. Changes in average net assets of TOP-100 companies in 2016-2019.
Shares of companies with property insufficiency in the TOP-100 had a positive downward trend during the five years period (Picture 2).
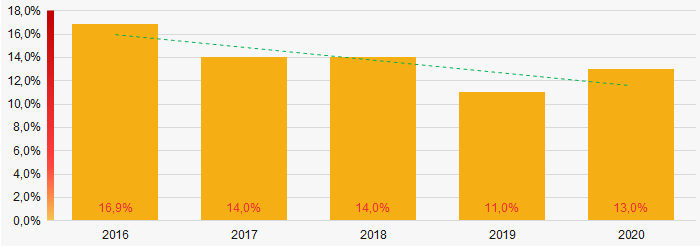 Picture 2. Shares of companies with negative net assets in the TOP-100 in 2016-2019
Sales revenue
Revenue of the top three companies in 2020 constituted over 54% of the total revenue of TOP-100 companies. (Picture 3). This indicates a high level of monopolization in the shipbuilding industry.
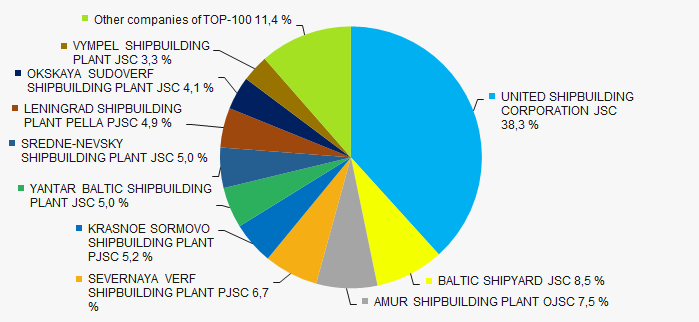 Picture 3. Shares of TOP-10 companies in the total revenue in 2020. TOP-100
In general, there is a tendency of revenue increasing with a positive growth rate. (Picture 4).
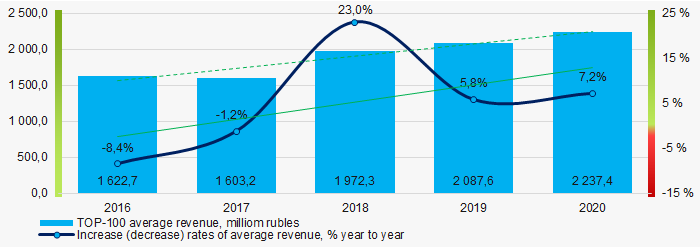 Picture 4. Changes in average revenue values of TOP-100 companies in 2016-2020
Profit and loss
The largest company in the TOP-100 in terms of net profit in 2020 is also UNITED SHIPBUILDING CORPORATION JSC. The company's profit amounted to 1.5 billion rubles.
During the five-year period, average loss rates of TOP-100 companies tend to increase. (Picturе 5).
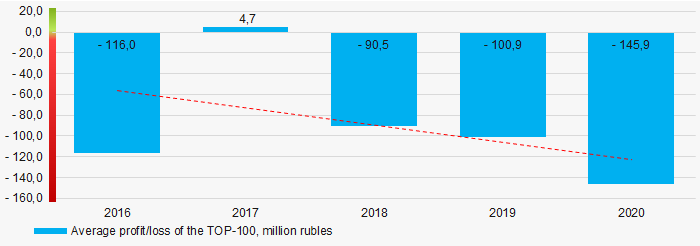 Picture 5.Changes in average profit (loss) indicators of TOP-100 companies in 2016-2020
During the past five years, average values of net profit indicators of TOP-100 companies have not decreased, while average net loss increased (Picture 6).
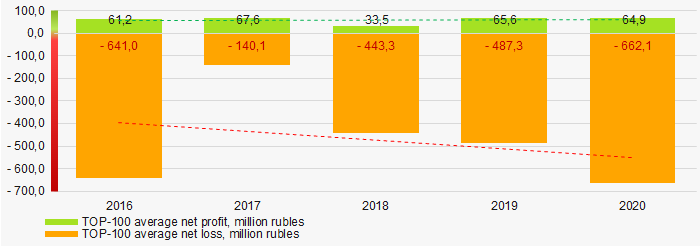 Picture 6. Changes in average values of net profit and net loss indicators of TOP-100 companies in 2016-2020.
Key financial ratios
During the five-year period, average values of the total liquidity ratio of TOP-100 companies were above the range of recommended values - from 1.0 to 2.0 with a downward trend. (Picture 7).
Total liquidity ratio (current assets to short-term liabilities) shows sufficiency of company’s assets to settle short-term liabilities.
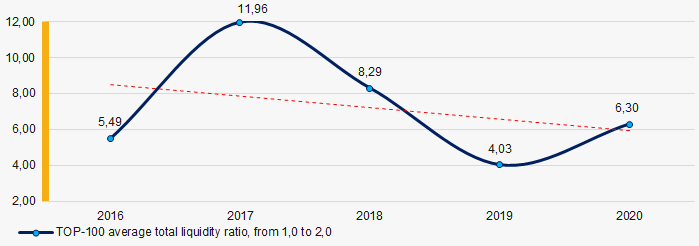 Picture 7. Changes in average values of total liquidity ratio of TOP-100 companies in 2016-2020.
During the past five years, average return on investments ratio of TOP 100 companies has shown an upward trend (Picture 8).
This ratio is calculated as ratio of net profit to amount of equity and long-term liabilities and demonstrates return on equity involved in commercial activities and the long-term funds raised by organization.
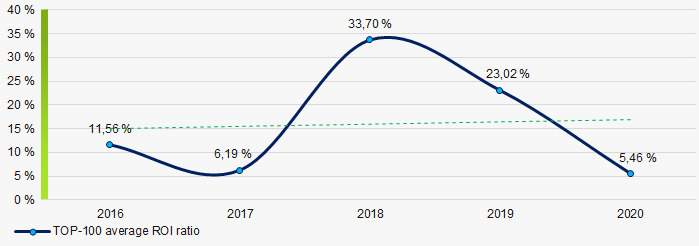 Picture 8. Changes in average values of the ROI ratio of TOP-100 companies in 2016-2020.
Asset turnover ratio is calculated as ratio of sales revenue to average value of total assets for a period and implicates the efficiency of use of all available resources; regardless of sources, they were raised. The ratio shows how many times per year the full cycle of production and turnover is performed generating the corresponding effect in the form of profit.
During the five-year period values of the said business activity ratio showed a trend to decrease (Picture 9).
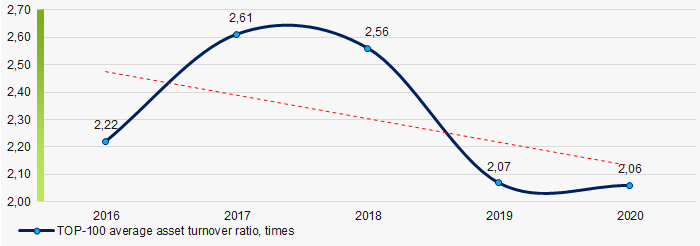 Picture 9. Changes in average values of the asset turnover ratio of TOP-100 companies in 2016-2020
Small enterprises
75% of TOP-1000 companies are registered in the Unified Register of Small and Medium-sized Enterprises of the Russian Federation Federal Tax Service. At the same time, their share in the total revenue of the TOP-1000 in 2020 is only 2%, which is significantly lower than the national average in 2018-2019. (Picture 10).
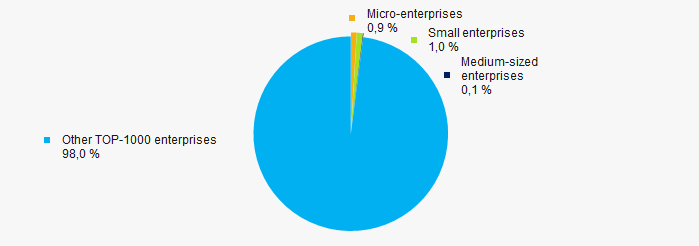 Picture 10. Revenue share of small and medium-sized enterprises in the TOP-100
Main regions of activity
The TOP-100 companies are registered in 30 regions and are distributed unevenly across the country due to the geographical specifics of shipbuilding industry. Almost 62% of the total revenue of TOP-100 companies in 2020 is concentrated in St. Petersburg (Picture 11).
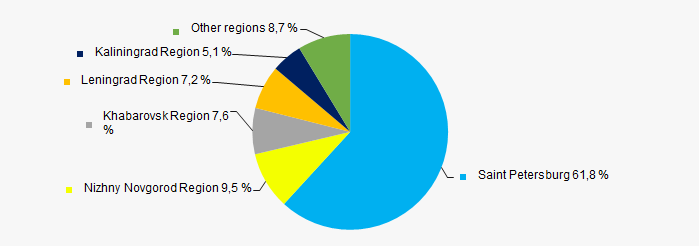 Picture 11. Distribution of TOP-100 companies' revenue by regions of Russia
Financial position score
The assessment of the financial position of TOP-100 companies shows that the largest part of them is in a financial position above average. (Picture 12).
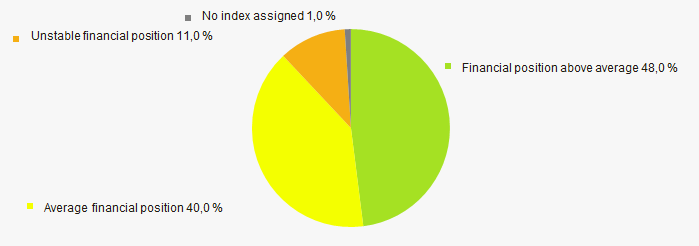 Picture 12. Distribution of TOP-100 companies by financial position score
Globas Solvency Index
The vast majority of TOP-100 companies are assigned superior and high Globas Solvency Index, which indicates their ability to repay their debt obligations on time and fully (Picture 13).
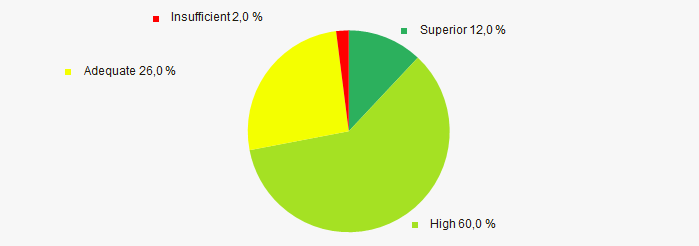 Picture 13. Distribution of TOP-100 companies according to the Globas Solvency Index
Conclusion
Comprehensive assessment of activities of the largest shipbuilding enterprises, that takes into account main indexes, financial indicators and coefficients, indicates predominance of positive trends in their activities in the period from 2016 to 2020. (Table 1).
| Trends and evaluation factors | Share of factor, % |
| Dynamics of average net assets value |  10 10 |
| Growth (decline) rate in average size of net assets |  10 10 |
| Increase / decrease in share of enterprises with negative values of net assets |  10 10 |
| Level of equity concentration |  -10 -10 |
| Dynamics of average revenue |  10 10 |
| Growth (decline) rate in average size of revenue |  10 10 |
| Dynamics of average profit (loss) |  -10 -10 |
| Growth / decline in average values of companies’ net profit |  10 10 |
| Increase / decline in average values of companies' net loss |  -10 -10 |
| Increase / decrease in average values of overall liquidity ratio |  -5 -5 |
| Increase / decrease in average values of return on investment ratio |  10 10 |
| Increase / decrease in average values of asset turnover ratio, times |  -10 -10 |
| The share of small and medium-sized enterprises in revenue is more than 20% |  -10 -10 |
| Regional concentration |  -5 -5 |
| Financial position (the largest share) |  10 10 |
| Globas Solvency Index (the largest share) |  10 10 |
| Average value of factors share |  1,9 1,9 |
 positive trend (factor),
  negative trend (factor)