TOP 1000 of the companies in Samara
Among the largest companies in Samara in 2016 – 2020 prevail positive activity trends. The most important are decline in net loss and decrease in share of companies with insufficient property, high values of return on investment ratio. Among negative trends there is decline in companies’ average net profit.
For the activity trends analysis among the largest companies in Samara information agency Credinform selected the largest companies of the city (TOP 1000) with the highest annual revenue according to the data from the Statistical Register and the Federal Tax Service for the latest available periods (2016 – 2020). The selection and analysis of companies were based on the data of the Information and Analytical system Globas.
Net assets are total assets less total liabilities. This indicator reflects the real value of the property of an enterprise. When the company’s debt exceeds the value of its property, the indicator is considered negative (insufficiency of property).
The largest company in term of net assets is LIMITED LIABILITY COMPANY RUSSIAN INNOVATION FUEL AND ENERGY COMPANY, INN 6317130144, extraction of petroleum. In 2020 net assets value of the company exceeded 338 billion RUB.
The lowest net assets value among TOP 1000 belonged to JOINT STOCK COMPANY SAMARA BEARING PLANT, INN 6318100431, manufacture of ball and rolling bearings, it was declared as insolvent (bankrupt) and bankruptcy proceedings were opened 24.04.2018. Insufficient property figured out negative value – 2.3 billion RUB.
Covering the five-year period, the average net assets values of TOP 100 have a trend to increase with the decreasing growth rate (Picture 1).
 Picture 1. Change in average net assets values in 2016 – 2020
Over the past five years, the share of companies with insufficient property had a positive trend to decrease (Picture 2).
 Picture 2. Shares of TOP 1000 companies with negative net assets value in 2016-2020
Sales revenue
In 2020, the revenue volume of the ten largest companies was about 47% of total TOP 1000 revenue (Picture 3). This is indicative of a relatively high level of capital concentration among companies in Samara.
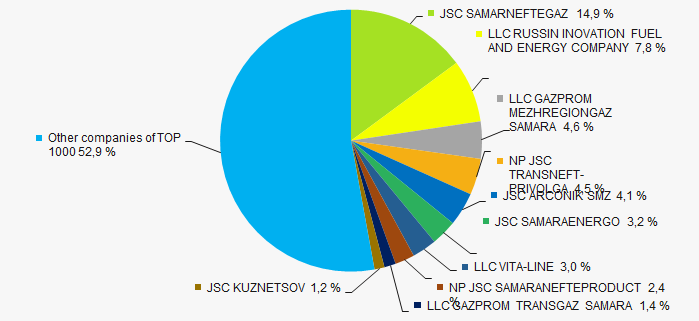 Picture 3. The share of TOP 10 companies in total 2020 revenue of TOP 1000
In general, there is a trend to increase in revenue with the decreasing growth rate (Picture 4).
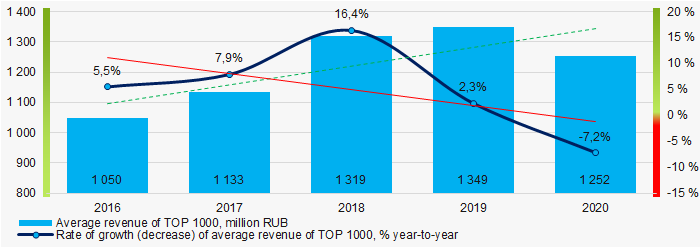 Picture 4. Change in average revenue in 2016 – 2020
Profit and loss
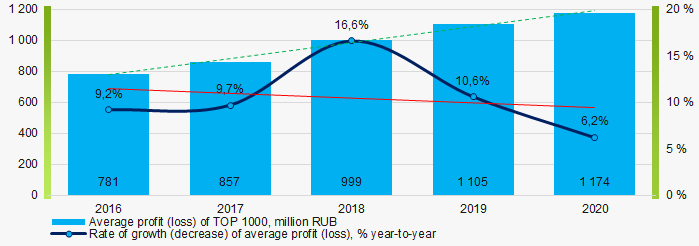
In 2020, the largest organization in term of profit was JOINT STOCK COMPANY SAMARANEFTEGAS, INN 6315229162, extraction of petroleum. The company’s profit almost exceeded 34 billion RUB. Covering the five-year period, there is a trend to decrease in average net profit and growth rate (Picture 5).
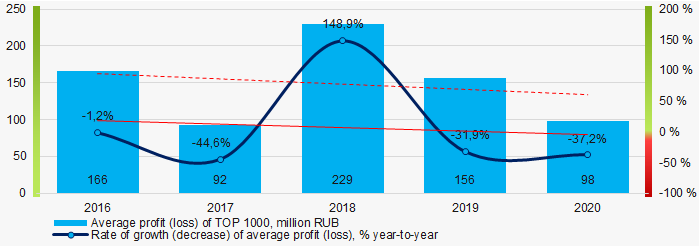 Picture 5. Change in average profit (loss) values of TOP 1000 in 2016 – 2020
For the five-year period, the average profit of TOP 1000 have the decreasing trend with the increasing net loss (Picture 6).
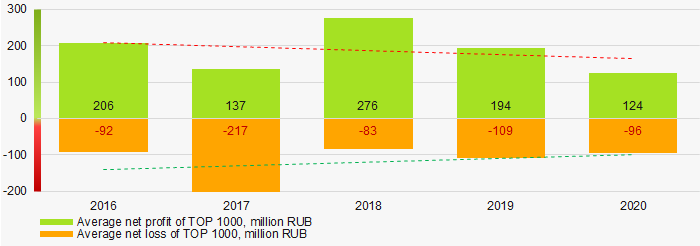 Picture 6. Change in average net profit and net loss of ТОP 1000 in 2016 - 2020
Key financial ratios
Covering the five-year period, the average values of the current liquidity ratio were above the recommended one - from 1,0 to 2,0 with a trend to increase (Picture 7).
Current liquidity ratio (current assets to short-term liabilities) shows the sufficiency of company’s assets to repay on short-term liabilities.
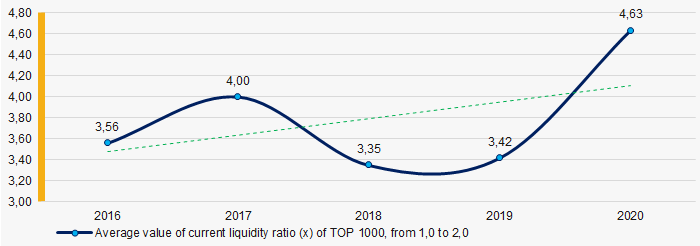 Picture 7. Change in industry average values of current liquidity ratio of TOP 1000 in 2016 – 2020
Covering the five-year period, the average values of ROI ratio had a trend to increase (Picture 8).
ROI ratio is calculated as net profit to sum of shareholders equity and long-term liabilities, and shows the return of equity involved in commercial activities and long-term borrowed funds.
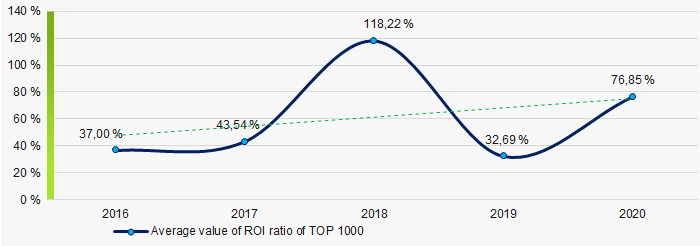 Picture 8. Change in industry average values of ROI ratio of TOP 1000 in 2016 - 2020
Assets turnover ratio is the ratio of sales revenue and company’s average total assets for a period. It characterizes the effectiveness of using of all available resources, regardless the source of their attraction. The ratio shows how many times per year the full cycle of production and circulation is performed, generating the corresponding effect in the form of profit.
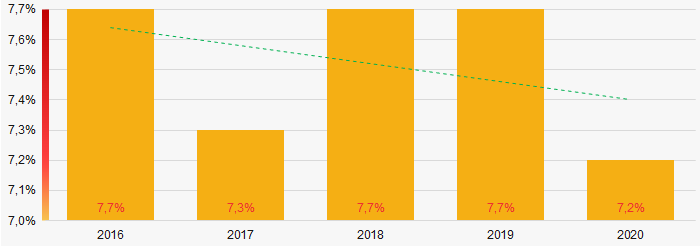
Covering the five-year period, business activity ratio demonstrated the decreasing trend (Picture 9).
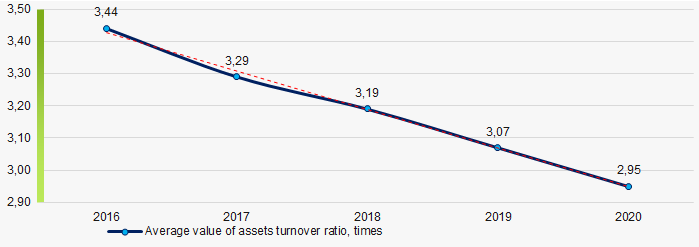 Picture 9. Change in average values of assets turnover ratio of TOP 1000 in 2016 – 2020
Small business
84% of companies of TOP 1000 are registered in the Register of small and medium-sized enterprises of the Federal Tax Service of the Russian Federation. In 2020, their share in total revenue of TOP 1000 is 24.4%, higher than the average country values in 2018-2019 (Picture 10).
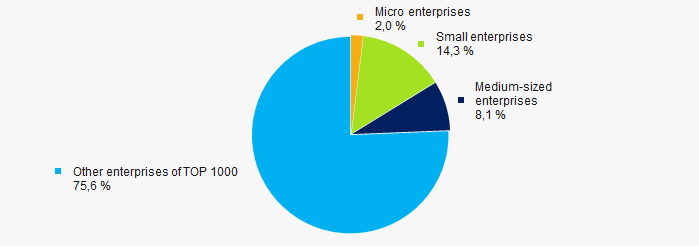 Picture 10. Shares of small and medium-sized enterprises in TOP 1000
Financial position score
Assessment of the financial position of TOP 1000 companies shows that the financial position of the majority of them is above average (Picture 11).
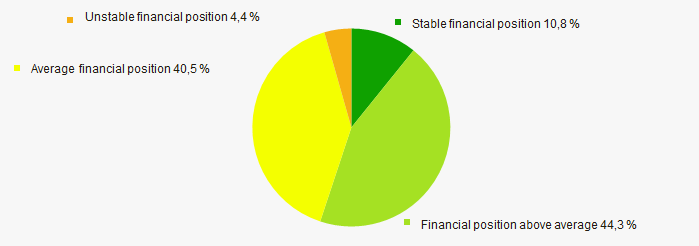 Picture 11. Distribution of TOP 1000 companies by financial position score
Solvency index Globas
Most of TOP 1000 companies got Superior / High indexes Globas. This fact shows their ability to meet their obligations on time and in full (Picture 12).
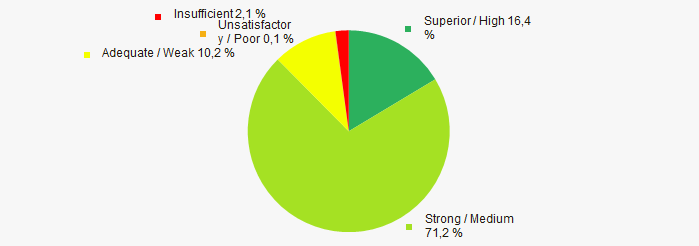 Picture 12. Distribution of TOP 1000 companies by solvency index Globas
Conclusion
Complex assessment of activity of the largest companies in Samara, taking into account the main indexes, financial ratios and indicators, demonstrates the prevalence of positive trends in their activities in 2016 - 2020 (Table 1).
| Trends and evaluation factors | Relative share of factors, % |
| Dynamics of the average net assets value |  10 10 |
| Rate of growth (decrease) in the average size of net assets |  -10 -10 |
| Increase (decrease) in the share of enterprises with negative values of net assets |  10 10 |
| Level of competition / monopolization |  -10 -10 |
| Dynamics of the average revenue |  10 10 |
| Rate of growth (decrease) in the average size of revenue |  -10 -10 |
| Dynamics of the average profit (loss) |  -10 -10 |
| Rate of growth (decrease) in the average profit (loss) |  -10 -10 |
| Growth / decline in average values of companies’ net profit |  -10 -10 |
| Growth / decline in average values of companies’ net loss |  10 10 |
| Increase / decrease in average values of total liquidity ratio |  5 5 |
| Increase / decrease in average values of return on investment ratio |  10 10 |
| Increase / decrease in average values of asset turnover ratio, times |  -10 -10 |
| Share of small and medium-sized businesses in terms of revenue being more than 20% |  10 10 |
| Financial position (the largest share) |  10 10 |
| Solvency index Globas (the largest share) |  10 10 |
| Average value of relative share of factors |  0,9 0,9 |
 positive trend (factor),
  negative trend (factor)
Electric equipment manufacturers in Samara
Performance evaluation of liabilities to assets ratio of the largest electric equipment and electronics manufacturers in Samara in 2020 indicates the extra debt load of the enterprises and it can worsen stability of their financial position.
Information agency Credinform selected for this ranking companies with the largest volume of annual revenue according to the data from the Statistical Register and the Federal Tax Service for the latest available periods (2018 - 2020). These companies manufacture computers, peripheral units, communication tools and similar electronic products, and also applications that produce, split and use electric power (TOP 10 and TOP 100). They were ranked by liabilities to assets ratio (Table 1).The selection and analysis were based on the data of the Information and Analytical system Globas.
Liabilities to assets ratio shows the share of assets financed by loans. The standard value for this ratio is from 0.2 to 0.5
Sales revenue and net profit show the scale of the company and the efficiency of its business, and the liabilities to assets ratio indicates the risk of insolvency of the company.
Exceeding the upper standard value indicates excessive debt load, which can stimulate development, but negatively affects the stability of the financial position. If the value is below the standard value, this may indicate a conservative strategy of financial management and excessive caution in attracting new borrowed funds.
For the most complete and objective view of the financial condition of the enterprise, it is necessary to pay attention to the complex of indicators and financial ratios of the company.
| Name, INN, type of activity | Revenue, million RUB. | Net profit (loss), million RUB. | Liabilities to assets ratio (x), from 0,2 to 0,5 | Solvency index Globas | |||
| 2019 | 2020 | 2019 | 2020 | 2019 | 2020 | ||
| 1 | 2 | 3 | 4 | 5 | 6 | 7 | 8 |
| OOO PK ELEKTRUM INN 6315597656 Manufacture of electricity distribution and control apparatus |
 1 871,8 1 871,8 |
 1 315,2 1 315,2 |
 -0,8 -0,8 |
 14,1 14,1 |
 0,99 0,99 |
 0,95 0,95 |
260 Medium |
| OOO EKKA INN 6314042860 Manufacture of other electrical equipment |
 285,5 285,5 |
 397,9 397,9 |
 17,6 17,6 |
 10,3 10,3 |
 0,89 0,89 |
 0,87 0,87 |
265 Medium |
| AO GK ELECTROSHIELD - TM SAMARA INN 6313009980 Manufacture of electric motors, generators and transformers, except repair |
 10 861,8 10 861,8 |
 1 234,9 1 234,9 |
 -1 671,2 -1 671,2 |
 -538,6 -538,6 |
 0,78 0,78 |
 0,61 0,61 |
289 Medium |
| AO NPTS INFOTRANS INN 6311012176 Manufacture of other devices, sensors, equipment and tools for measuring, control and testing |
 1 833,3 1 833,3 |
 1 792,2 1 792,2 |
 222,2 222,2 |
 165,4 165,4 |
 0,59 0,59 |
 0,49 0,49 |
152 Superior |
| CZ EMI INN 6318100022 Manufacture of wiring devices |
 1 187,1 1 187,1 |
 1 252,6 1 252,6 |
 76,3 76,3 |
 110,1 110,1 |
 0,49 0,49 |
 0,48 0,48 |
180 High |
| OOO NVF SMS INN 6315506610 Manufacture of automatic regulating or controlling instruments and apparatus |
 931,5 931,5 |
 1 583,4 1 583,4 |
 10,1 10,1 |
 7,7 7,7 |
 0,57 0,57 |
 0,48 0,48 |
194 High |
| OOO NTF BACS INN 6311007747 Manufacture of instruments and appliances for measuring, testing and navigation |
 1 836,3 1 836,3 |
 932,5 932,5 |
 536,1 536,1 |
 131,8 131,8 |
 0,53 0,53 |
 0,46 0,46 |
219 Strong |
| JOINT STOCK COMPANY SAMARA CABLE COMPANY INN 6318101450 Manufacture of other wires and cables for electronic and electric equipment |
 5 868,6 5 868,6 |
 5 538,8 5 538,8 |
 182,0 182,0 |
 223,4 223,4 |
 0,44 0,44 |
 0,40 0,40 |
174 Superior |
| LIMITED LIABILITY COMPANY METROLOGY AND AUTOMATION INN 6330013048 Manufacture of instruments and appliances for measuring, testing and navigation |
 549,3 549,3 |
 399,2 399,2 |
 28,3 28,3 |
 5,3 5,3 |
 0,29 0,29 |
 0,32 0,32 |
248 Strong |
| OOO BITAS INN 6318149028 Manufacture of instruments and appliances for measuring, testing and navigation |
 305,6 305,6 |
 404,4 404,4 |
 27,9 27,9 |
 48,3 48,3 |
 0,15 0,15 |
 0,11 0,11 |
192 High |
| Average value for TOP 10 companies |  2 553,1 2 553,1 |
 1 485,1 1 485,1 |
 -57,1 -57,1 |
 17,8 17,8 |
 0,57 0,57 |
 0,52 0,52 |
|
| Average value for TOP 100 companies |  308,6 308,6 |
 293,4 293,4 |
 -3,1 -3,1 |
 3,6 3,6 |
 0,65 0,65 |
 0,83 0,83 |
|
 improvement compared to prior period,
  decline compared to prior period
Indicators of six companies show liabilities to assets ratio within the standard value. However, average values of TOP 10 and Top 100 in 2020 is above the standard value.
Moreover, in 2020 three companies of TOP 10 increased the revenue and five companies gained the net profit. The revenue of TOP 10 fell at average 42% and TOP 100 at 5%. The average net profit of TOP 10 and TOP 100 increased more than 2 times.
In general, during last 5 years, the average industry values of liabilities to assets ratio were constantly decreasing toward reaching the interval of the standard value. (Picture 1).
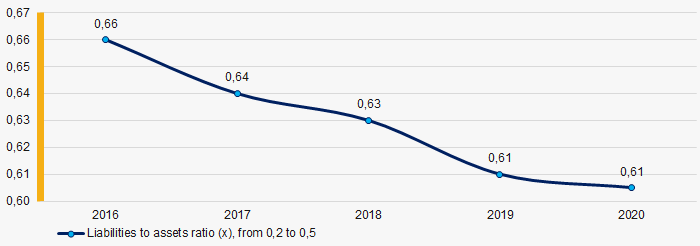 Picture 1. Change in the industry average values of the liabilities to assets ratio of the electric equipment and electronics manufacturers in 2016 – 2020.