Anti-Corruption Charter
Guided by the Decree No. 309 of the President of the Russian Federation dated April 2, 2013 «On Countering Corruption» and the Federal Law No. 273-FZ dated December 25, 2008 «On Countering Corruption», the Russian Union of Industrialists and Entrepreneurs, the Chamber of Commerce and Industry of the Russian Federation, the all-Russian Public Organization “Delovaya Rossiya” and the all-Russian non-governmental organization of small and medium businesses “OPORA RUSSIA” initiated the signing of the «Anti-Corruption Charter of the Russian Business».
The representatives of the business community of the Russian Federation, realizing that success in business is impossible without a universal consensus on rejecting any form of corruption, declared their intention to promote the principles of preventing and counteracting corruption — both in dealing with government authorities and in corporate relationships.
By signing the Charter, the participants declare and undertake to observe and promote the following basic principles of preventing and countering corruption:
1. Corporate governance based on anti-corruption programmes, which set principles, rules and procedures aimed at preventing corruption in all fields of corporate activities, including business ethics, special management procedures, personnel training requirements, special anti-corruption supervision and audit rules, conflict of interest and commercial bribery prevention procedures, donation, sponsorship, and charity rules.
2. Monitoring and evaluation of anti-corruption programme implementation in accordance with a company management structure and participation of internal supervision and audit bodies.
3. Effective financial control, which includes tools for auditing bookkeeping and accounting practices, human resource management and other activities, and regular review of internal control systems in accordance with anti-corruption programme requirements. Thus, among unacceptable are the following things: generation of off-the-books (double) accounts; making of off-the-books or inaccurately accounted transactions; recording of non-existent expenses; entry of liabilities with incorrect identification of their objects; intentional destruction of accounting and other documents earlier than foreseen by law.
4. Personnel training and supervision based on anti-corruption programmes with the guarantees that none of the employees will suffer in terms of career-development or financial harm if they reject corrupt practices, even if such rejection leads to financial damages for the company.
5. Collective efforts and publicity of anti-corruption measures with the use of mechanisms to communicate anti-corruption programme information within the company. Companies shall create an environment that enables their employees and other persons to freely identify programme defects and to promptly report suspicious circumstances to officers in charge.
6. Rejection of illegally obtained benefits while promoting the interests in order to strengthen the market positions. Such rules shall envisage rejection of gifts and paying expenses, donations and sponsorship contributions.
7. Partner and counterparty relationships based on anti-corruption policy principles. When assessing the due diligence of their partners and counterparties, companies shall take into account their degree of rejection of corrupt practices in doing business; companies shall monitor the soundness and proportionality of fees paid to agents, advisors and other intermediaries. It shall be unacceptable for a company to promise, offer, give or accept any undue benefit or advantage to any executive, officer or employee of another company for any action or omission in violation of the established duties. When the government authorities perform control and audit functions, companies shall assist them in creating conditions for non-biased inspections and shall not impede lawful actions of such authorities.
8. Promotion of justice and respect for the rule of law, counteracting legalization of criminal proceeds. Financial companies shall provide proper identification of clients, owners and beneficiaries and report about suspicious transactions to the competent authorities.
9. Combating bribery of foreign public officials and officials of international public organizations
The Charter is opened for all-Russian, regional and industry associations, Russian and foreign companies operating in Russia. At the same time companies can join the Charter directly or through the membership in organizations.
Currently, about 1700 organizations, companies and individual entrepreneurs have joined the Charter. Among them 17% engaged in professional scientific and technical activities, 14% engaged in manufacturing activity, 12% - trading companies.
The biggest share of participants is concentrated in Tyumen region (23%) and in Moscow and Moscow region (21%). In addition, 6% of the participants are already liquidated or in the process of liquidation.
The list of participants of the Charter is available in «Lists we recommend» of the Information and Analytical system Globas.
ТОP-1000 of North region companies
In order to reduce the interregional differences in the level and quality of life of the population, to accelerate economic growth and technological development and to ensure the national security of the country, in February 2019 the Russian Government approved the Strategy of Spatial Development of the Russian Federation until 2025. It consists of 12 macro-regions; one of them is North district, which includes: Arkhangelsk, Vologda and Murmansk regions, Nenets Autonomous Okrug, Republic of Karelia and Komi Republic.
Information agency Credinform has prepared a review of activity trends of the largest companies of the real economy sector in the Northern Economic Region of Russia.
The largest companies (ТОP-1000) in terms of annual revenue were selected according to the data from the Statistical Register for the latest available periods (2013 - 2018). The analysis was based on data of the Information and Analytical system Globas.
Net assets is a ratio reflecting the real value of company's property. It is calculated annually as the difference between assets on the enterprise balance and its debt obligations. The ratio is considered negative (insufficiency of property), if company’s debt exceeds the value of its property.
The largest company in terms of net assets is LLC LUKOIL-KOMI, INN 1106014140, Komi Republic. In 2018 net assets of the company amounted to almost 385 billion RUB.
The smallest size of net assets in TOP-1000 had LLC OIL COMPANY NORTHERN RADIANCE, INN 8300005580, Nenets Autonomous Okrug. The company is in liquidation since 27.07.2017. The lack of property of the company in 2018 was expressed in negative terms -20 billion RUB.
For the last five years, the average values of TOP-1000 net assets showed the growing tendency (Picture 1).
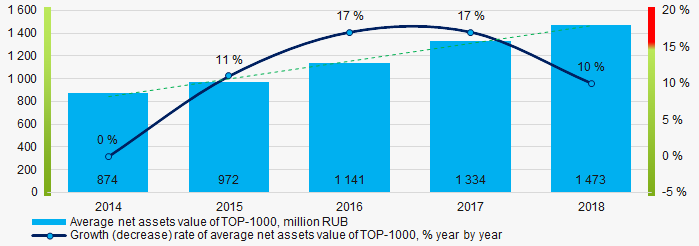 Picture 1. Change in average net assets value of ТОP-1000 companies in 2014 – 2018
For the last five years, the share of ТОP-1000 enterprises with lack of property is decreasing (Picture 2).
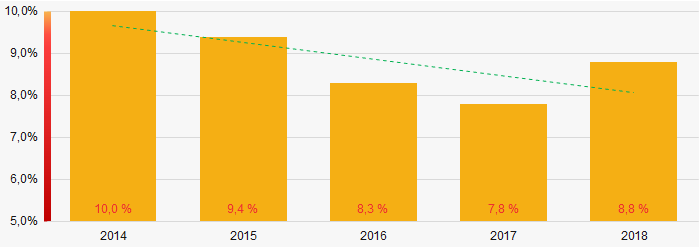 Picture 2. The share of enterprises with negative net assets value in ТОP-1000
Sales revenue
In 2018, the total revenue of 10 largest companies amounted to almost 55% from ТОP-1000 total revenue (Picture 3). This fact testifies the high level of capital concentration.
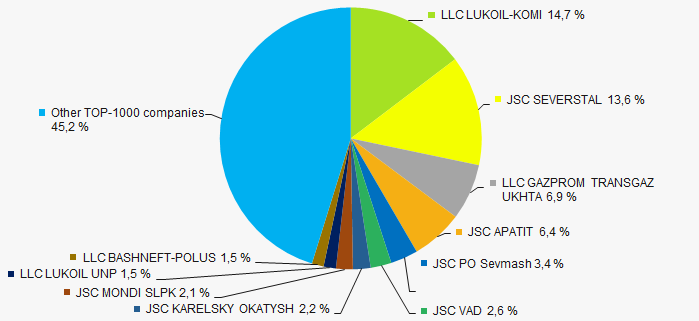 Picture 3. Shares of TOP-10 in TOP-1000 total revenue for 2018
In general, the growing trend in sales revenue is observed (Picture 4).
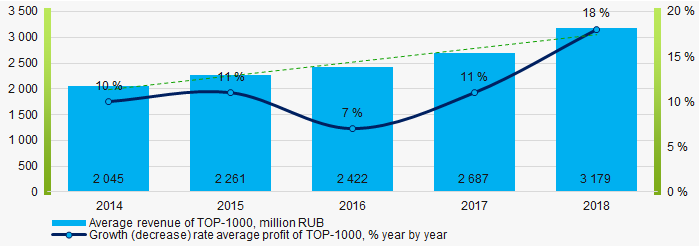 Picture 4. Change in average revenue of TOP-1000 in 2014 – 2018
 Profit and loss
The largest company in terms of net profit is JSC SEVERSTAL, INN 3528000597, Vologda region. In 2018 the company’s profit amounted to 124 billion RUB.
For the last five years, the average profit values of TOP-1000 show the growing tendency (Picture 5).
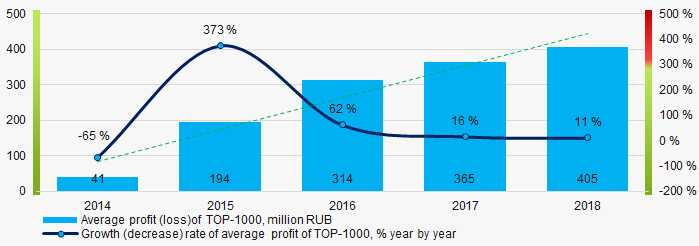 Picture 5. Change in average profit of TOP-1000 in 2014 – 2018
 Over a five-year period, the average net profit values of ТОP-1000 show the growing tendency, along with this the average net loss is decreasing (Picture 6).
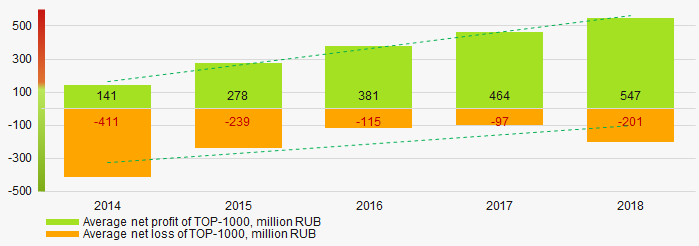 Picture 6. Change in average net profit/loss of ТОP-1000 companies in 2014 – 2018
Main financial ratios
For the last five years, the average values of the current liquidity ratio were higher than the recommended values - from 1,0 to 2,0, with growing trend (Picture 7).
The current liquidity ratio (ratio of total working capital to short-term liabilities) shows the sufficiency of company’s assets to meet short-term obligations.
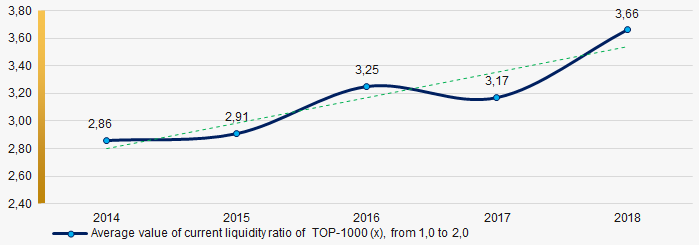 Picture 7. Change in average values of current liquidity ratio of TOP-1000 companies in 2014 – 2018
For four years out of five, the high level of the average values of ROI ratio with downward trend is observed (Picture 8).
The ROI ratio is calculated as a ratio of net profit to sum of stockholder equity and long-term liabilities and shows the return from equity involved in commercial activities and long-term borrowed funds.
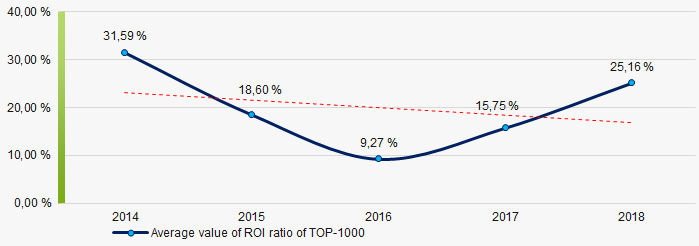 Picture 8. Change in average values of ROI ratio in 2014 – 2018
 Assets turnover ratio is the ratio of sales revenue and company’s average total assets for a period. It characterizes the effectiveness of using of all available resources, regardless the source of their attraction. The ratio shows how many times per year the full cycle of production and circulation is performed, generating the corresponding effect in the form of profit.
For the last five years, this business activity ratio demonstrated the downward trend (Picture 9).
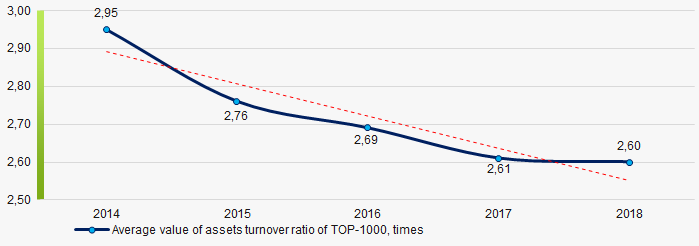 Picture 9. Change in average values of assets turnover ratio of TOP-1000 companies in 2014 – 2018
 Small businesses
55% of ТОP-1000 companies are registered in the Unified register of small and medium-sized enterprises of the Russian Federal Tax Service. Herein, their share in TOP-1000 total revenue is about 9%, which is significantly lower than the national average value in 2018-2019 (Picture 10).
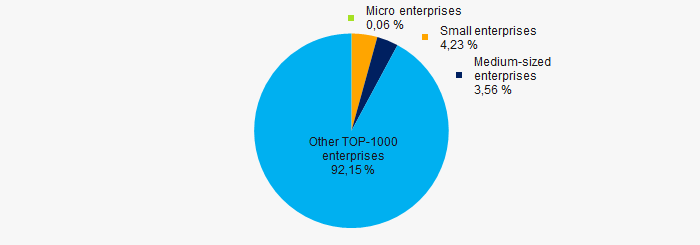 Picture 10. Shares of small and medium-sized enterprises in ТОP-1000
Main regions of activity
ТОP-1000 companies are unequally located across the country and registered in 6 regions of Russia. More than 69% of the largest enterprises in terms of revenue are located in the Komi Republic and Vologda region (Picture 11).
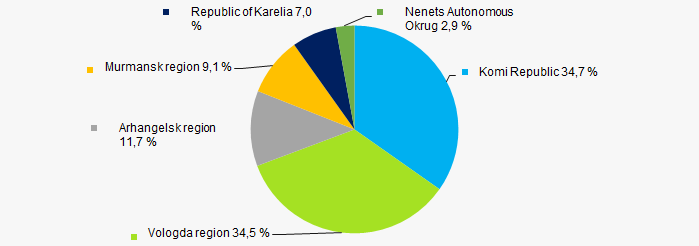 Picture 11. Distribution of TOP-1000 revenue over the territory of the Northern Economic Region of Russia
 Financial position score
An assessment of the financial position of TOP-1000 companies shows that the largest part have above average financial position (Picture 12).
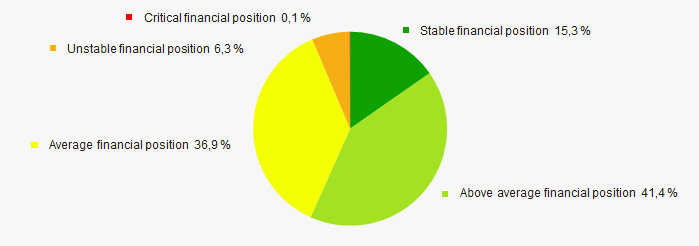 Picture 12. Distribution of TOP-1000 companies by financial position score
Solvency index Globas
Most of TOP-1000 companies got superior/high or strong/medium Solvency index Globas, this fact shows the ability of the companies to meet their obligations in time and fully (Picture 13).
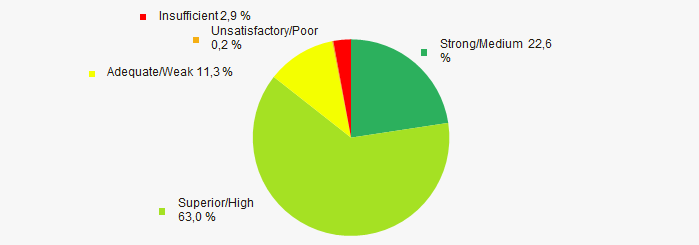 Picture 13. Distribution of TOP-1000 companies by Solvency index Globas
Industrial production index
According to the Federal Service of State Statistics, there is a downward trend in the industrial production index in the Northern Economic Region of Russia during 12 months of 2019 – 2020 (Picture 14). Herewith the average index from month to month amounted to 100,6%.
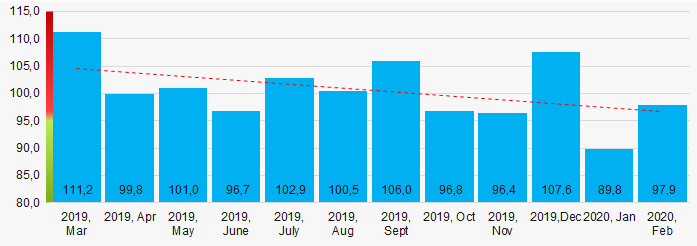 Picture 14. Average industrial production index in the Northern Economic Region of Russia in 2019-2020, month by month (%)
According to the same data, the share of enterprises of the Northern Economic Region of Russia in the amount of revenue from the sale of goods, works, services made 2,26% countrywide in 2019, that is higher than in 2018 (2,136%).
Conclusion
A complex assessment of activity of the largest companies of real economy sector in the Northern Economic Region of Russia, taking into account the main indexes, financial ratios and indicators, demonstrates the presence of positive trends (Table 1).
| Trends and assessment factors | Relative share, % |
| Growth/drawdown rate of average net assets value |  10 10 |
| Increase / decrease in the share of enterprises with negative net assets |  10 10 |
| The level of competition / monopolization |  -10 -10 |
| Growth/drawdown rate of average revenue |  10 10 |
| Growth/drawdown rate of average net profit (loss) |  10 10 |
| Increase / decrease in average net profit of companies |  10 10 |
| Increase / decrease in average net loss of companies |  10 10 |
| Increase / decrease in average values of current liquidity ratio |  5 5 |
| Increase / decrease in average values of ROI ratio |  -10 -10 |
| Increase / decrease in average values of assets turnover ratio, times |  -10 -10 |
| Share of small and medium-sized businesses by revenue more than 22% |  -10 -10 |
| Regional concentration |  -5 -5 |
| Financial position (the largest share) |  10 10 |
| Solvency index Globas (the largest share) |  10 10 |
| Industrial production index |  -5 -5 |
| Dynamics of the share of enterprises in the total amount of revenue countrywide |  10 10 |
| Average value of factors |  2,8 2,8 |
 favorable trend (factor),
  unfavorable trend (factor).