
Order a report
Custom-made industry research, company ratings, competitor analysis


Trends in automobile manufacture
Information agency Credinform has prepared a review of trends of the largest Russian automotive companies.
The largest automotive companies (TOP-10 and TOP-1000) in terms of annual revenue were selected for the analysis according to the data from the Statistical Register for the latest available periods (2015-2017). The analysis was based on the data of the Information and Analytical system Globas.
Net assets are total assets less total liabilities. This indicator reflects the real value of the property of an enterprise. When the company’s debt exceeds the value of its property, the indicator is considered negative (insufficiency of property).
| Position in TOP-1000, Name, INN, region, activity | Net assets value, billion RUB | Solvency index Globas | ||
| 2015 | 2016 | 2017 | ||
| 1 | 2 | 3 | 4 | 5 |
| 1 JSC KAMAZ INN 1650032058 Republic of Tatarstan Manufacture of cargo vehicles |
41,6 | |
|
192 High |
| 2 LLC HYUNDAI MOTOR MANUFACTURING RUS INN 7801463902 Saint Petersburg Manufacture of motor vehicles |
16,1 | |
|
209 Strong |
| 3 LLC VOLKSWAGEN GROUP RUS INN 5042059767 Kaluga region Manufacture of motor vehicles |
22,2 | |
|
237 Strong |
| 4 JSC GAZ INN 5200000046 Nizhniy Novgorod Manufacture of other parts and accessories for motor vehicles |
23,2 | |
|
210 Strong |
| 5 JSC RENAULT RUSSIA INN 7709259743 Moscow Manufacture of motor vehicles |
18,7 | |
|
219 Strong |
| 996 JSC AVTOKRAN INN 3731024644 Ivanovo region Manufacture of special purpose vehicles Process of being wound up since 08.06.2017 |
-1,0 | |
|
600 Insufficient |
| 997 JSC AUTOMOBILES AND MOTORS OF URAL INN 6658169550 Sverdlovsk region Manufacture of motor vehicles Process of being wound up since 17.02.2012 |
-3,9 | |
|
600 Insufficient |
| 998 LLC FORD SOLLERS HOLDING INN 1646021952 Republic of Tatarstan Manufacture of motor vehicles |
4,0 | |
|
311 Adequate |
| 999 JSC AVTOVAZ INN 6320002223 Samara region Manufacture of motor vehicles |
-43,1 | |
|
267 Medium |
| 1000 JSC CHEBOKSARY AGGREGATE WORKS INN 2126001687 Republic of Chuvashia Manufacture of other parts and accessories for motor vehicles Case of recognition of the company’s bankruptcy is considered |
-2,0 | |
|
550 Insufficient |
![]() — growth of indicator in comparison with prior period,
— growth of indicator in comparison with prior period, ![]() — growth of indicator in comparison with prior period.
— growth of indicator in comparison with prior period.
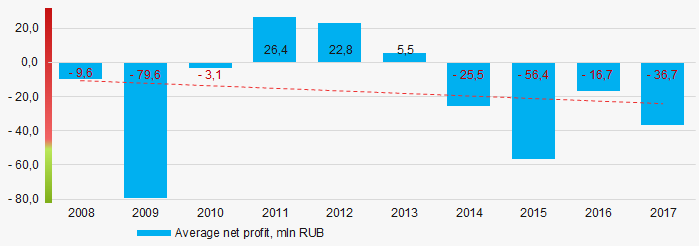
For the last 10 years, the average values of net assets showed the decreasing tendency (Picture 1).
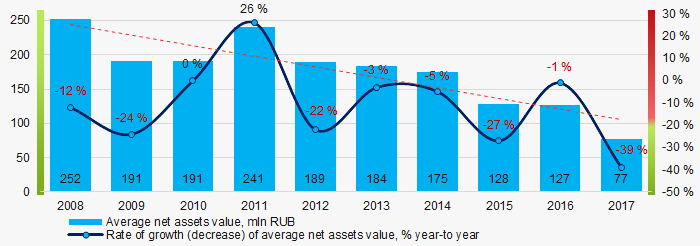 Picture 1. Change in average net assets value in 2008 – 2017
The shares of TOP-1000 companies with insufficient property are on a relatively high level with the trend to decrease over the past three years (Picture 2).
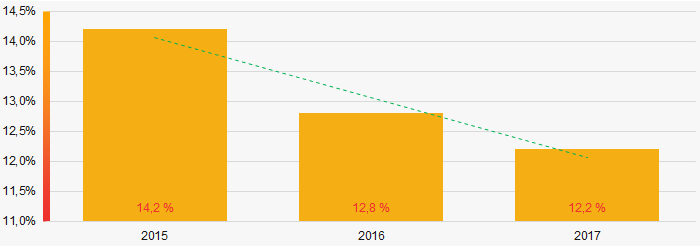 Picture 2. Shares of companies with negative net assets value in TOP-1000, 2015 - 2017
Sales revenue
In 2017, total revenue of 10 largest companies in the industry was 58% of TOP-1000 total revenue (Picture 3). This testifies relatively high level of monopolization in the industry.
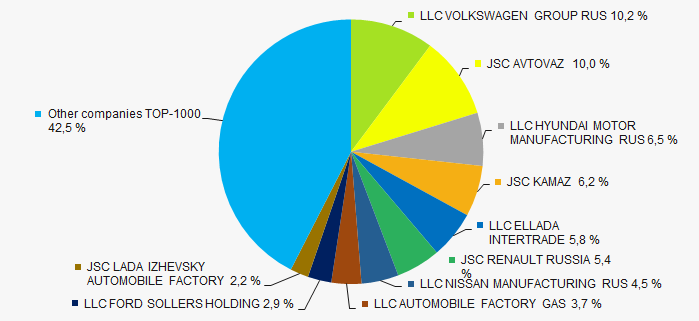 Picture 3. Shares of TOP-10 companies in TOP-1000 total profit for 2017
In general, there is a trend to decrease in industry average revenue over the past 10 years (Picture 4).
 Picture 4. Change in industry average net profit in 2008-2017
Profit and loss
In 2017, profit of 10 largest companies in the region amounted to 54% of TOP-1000 total profit (Picture 5).
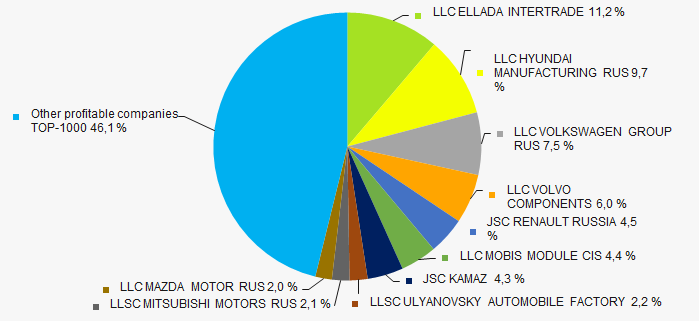 Picture 5. Shares of TOP-10 companies in TOP-1000 total profit for 2017
For the last ten years, the industry average net profit values were mainly in the negative zone. Thus, the companies’ net loss values have the trend to decrease (Picture 6).
 Picture 6. Change in industry average net profit (loss) in 2008-2017
For the three-year period, the average net profit values of TOP-1000 companies increase with the average net loss value having the increasing trend (Picture 7).
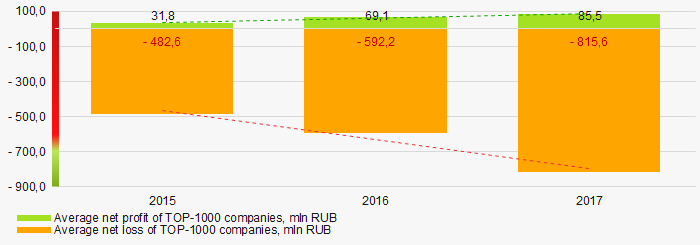 Picture 7. Change in average profit and loss of ТОP-1000 in 2015 – 2017
Key financial ratios
For the last ten years, since 2014 the average values of the current liquidity ratio were above the recommended one - from 1,0 to 2,0 with a trend to decrease (Picture 8).
Current liquidity ratio (current assets to short-term liabilities) shows the sufficiency of company’s assets to repay on short-term liabilities.
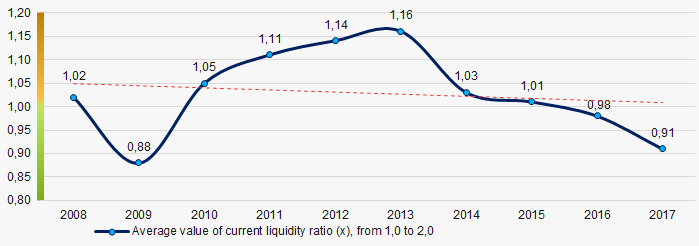 Picture 8. Change in industry average values of current liquidity ratio in 2008 – 2017
For the last ten years, the average values of ROI ratio have the trend to decrease (Picture 9).
ROI ratio is calculated as net profit to sum of shareholders equity and long-term liabilities, and shows the return of equity involved in commercial activities and long-term borrowed funds.
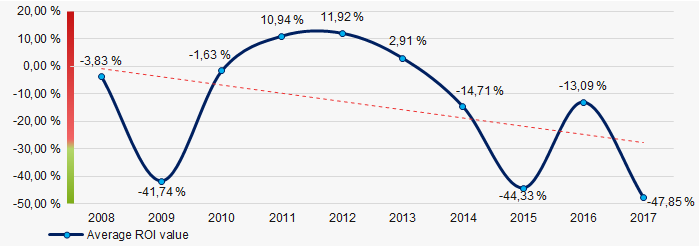 Picture 9. Change in average values of ROI ratio in 2008 – 2017
Assets turnover ratio is the ratio of sales revenue and company’s average total assets for a period. It characterizes the effectiveness of using of all available resources, regardless the source of their attraction. The ratio shows how many times per year the full cycle of production and circulation is performed, generating the corresponding effect in the form of profit.
For the last ten years, business activity ratio demonstrated the increasing trend (Picture 10).
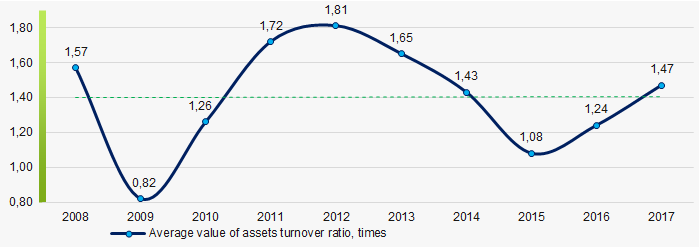 Picture 10. Change in average values of assets turnover ratio in 2008 – 2017
Production structure
The highest share in total revenue of TOP-1000 falls for companies with broad specialization in the manufacture of motor vehicles (Picture 11).
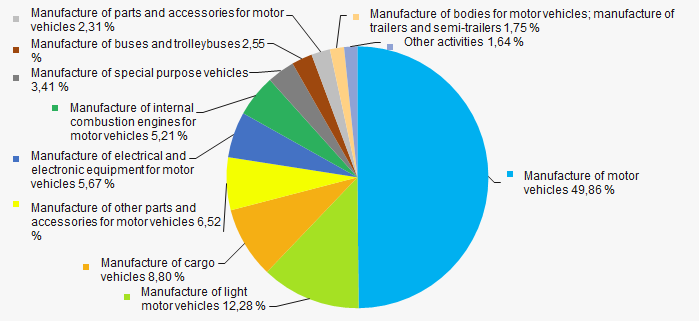 Picture 11. Distribution of activity types in total revenue of TOP-1000, %
71% companies of TOP-1000 are registered in the Register of small and medium-sized businesses of the Federal Tax Service of the Russian Federation. At the same time, their share in total revenue for 2017 amounted to only 5% that is much lower the national average (Picture 12).
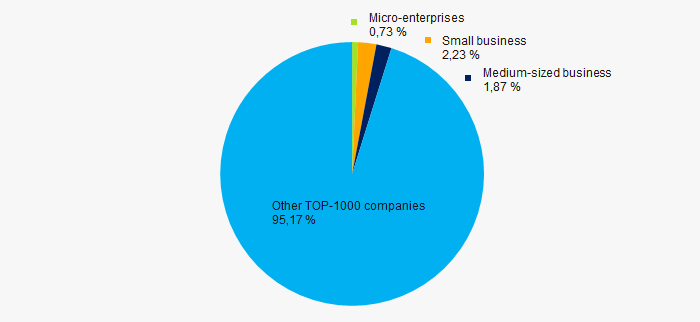 Picture 12. Shares of small and medium-sized enterprises in TOP-1000, %
Main regions of activity
Companies of TOP-1000 are located across the country quite equally, taking into account the specifics of industry production. The companies are registered in 65 districts. The highest shares of revenue volume are concentrated in the Republic of Tatarstan, Saint Petersburg, Samara region and Kaluga region (Picture 13).
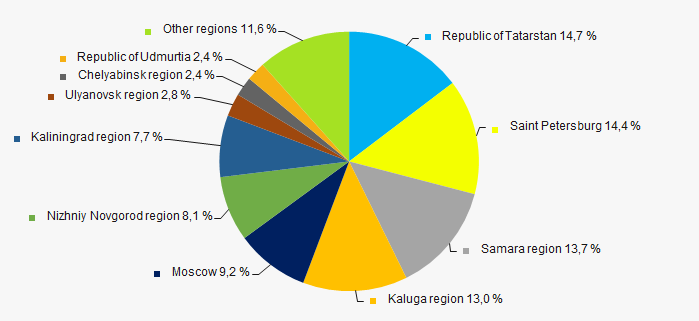 Picture 13. Distribution of TOP-1000 revenue by districts of Russia
Financial position score
Assessment of the financial position of TOP-1000 companies shows that the majority of them have average financial position (Picture 14).
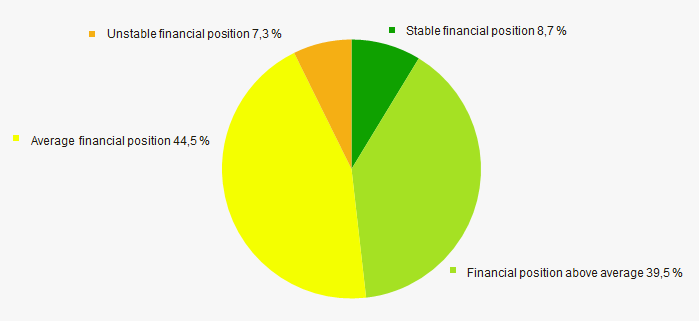 Picture 14. Distribution of TOP-1000 companies by financial position score
Solvency index Globas
Most of TOP-1000 companies got Superior / High and Strong / Medium index Globas. This fact shows their ability to meet their obligations fully (Picture 15).
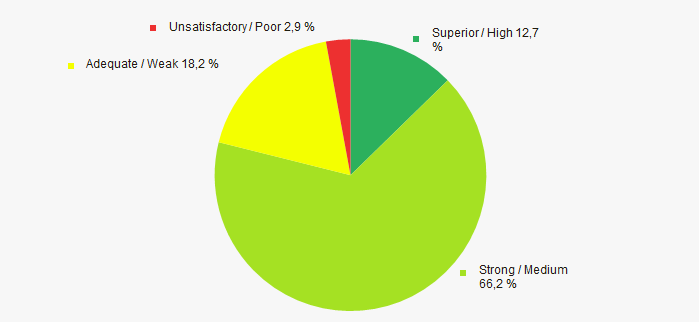 Distribution of TOP-1000 companies by solvency index Globas
Index of industrial production
According to the Federal State Statistics Service (Rosstat), during 12 months of 2018, the trend to decrease of industrial production indexes is observed (Picture 16). The average month-to-month figure WAS 101,7%.
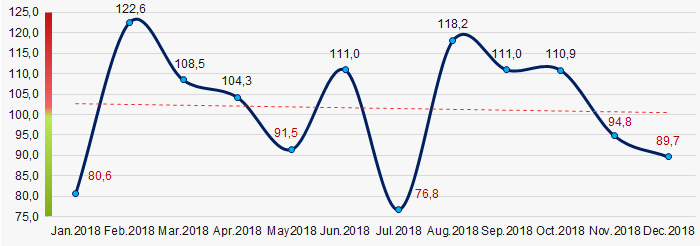 Picture 16. Index of industrial production of vehicles and equipment in 2018, month-to-month (%)
Conclusion
Complex assessment of activity of the largest automotive companies, taking into account the main indexes, financial ratios and indicators, demonstrates the prevalence of negative trends in the industry (Table 2).
| Trends and evaluation factors | Relative share of factors, % |
| Rate of growth (decline) in the average size of net assets | |
| Increase / decrease in the share of enterprises with negative values of net assets | |
| Rate of growth (decline) in the average size of revenue | |
| Concentration level of capital | |
| Rate of growth (decline) in the average size of profit (loss) | |
| Growth / decline in average values of companies’ net profit | |
| Growth / decline in average values of companies’ net loss | |
| Increase / decrease in average values of total liquidity ratio | |
| Increase / decrease in average values of return on investment ratio | |
| Increase / decrease in average values of asset turnover ratio, times | |
| Share of small and medium-sized businesses in the region in terms of revenue being more than 22% | |
| Regional concentration | |
| Financial position (the largest share) | |
| Solvency index Globas (the largest share) | |
| Industrial production index | |
| Average value of relative share of factors | |
![]() — positive trend (factor),
— positive trend (factor), ![]() — negative trend (factor).
— negative trend (factor).
Resale of extracts from the EGRN runs risk of fines
Fines, web-resources blocking, suspension of operation for legal entities and physical persons, reselling extracts from the Unified State Register of Immovable Property (EGRN) – such offers are included in the bill of the Federal Law, transmitted by the Ministry of Economic Development of Russia in March of 2019 for approval to the State Duma.
Relevance of a bill, according to the developers, is caused by large amount of web-sites, providing extracts from the EGRN, also for a fee. Therefore, public service, entrusted on the Federal service of State Registration, Cadastral Records and Cartography (Rosreestr), is provided by commercial organizations without quality control on the part of government department. Besides, the service is of high demand. Market volume of extracts from the EGRN is valued at 2,5 billion RUB.
It is provided by the bill to make amendments to the Administrative Offences Code and impose liability for creation, filling content, maintenance and usage of web-sites, disclosing data from the EGRN. Sanctions can make a considerable amount. For example, fine amount up to 600 thousand RUB is assumed for repeated violation.
If the bill will be adopted, amendments are expected to finish up to the end of 2019. According to the initiator of the bill, appliance of new norms let reduce risks of unauthorized access to the EGRN, because of which responsible users of public services are not able to get access to system resources and servers of Rosreestr.
Limitations referenced in the bill can not only affect «spoof-websites» of Rosreestr, but also cause change of application rules of this information for reliable distributors. Data from the Rosreestr are used by organizations, for those providing of extracts from the EGRN is not main activity, e.g. notaries, lawyers and other organizations, providing clients with extracts on commercial basis as related service.
Hopefully, reliable distributors of that service – professional information agencies will be assisted in access to the information, and data about legal entities and physical persons will be updated by important facts of real estate possession.
Public discussion of the bill will be finished on April 26, 2019.