
Order a report
Custom-made industry research, company ratings, competitor analysis


Net profit ratio of the largest Russian enterprises of grain wholesale
Information agency Credinform has prepared a ranking of the largest Russian enterprises of grain wholesale. The enterprises with the highest volume of revenue (TOP-10 and TOP-100) were selected for the ranking, according to the data from the Statistical Register for the latest available accounting periods (2015 and 2014) (TOP-10 and TOP-100). Then they were ranked by decrease in net profit ratio in 2015 (Table 1).
Net profit ratio (%) is calculated as a relation of net profit (loss) to sales revenue and shows sales profit rate. There is no prescribed value for this ratio. It is recommended to compare companies within one industry or change of the ratio with time for the particular enterprise. Negative value of the indicator shows net loss. High value of the indicator demonstrates efficient work of an enterprise.
Taking into account the actual situation both for the economy in general and in industries, experts of the Information agency Credinform, developed and realized in the Information and Analytical system Globas® calculation of actual values of financial ratios that can be normal for the particular industry. For grain wholesale companies actual value of the net profit ratio in 2015 was 0,19%.
For getting of the most comprehensive and fair picture of the financial standing of an enterprise it is necessary to pay attention to all available combination of financial indicators and ratios.
| Name, INN, region, foundation date | Net profit of 2015, mln RUB | Revenue of 2015, mln RUB | Revenue of 2015 to 2014, % | Net profit ratio, % | Solvency index Globas® |
| LLC ASTON TRADE HOUSE INN 6167045472 Rostov region 26.08.1998 | 623,8 | 15 881,7 | 11,3 | 3,93 | 198 The highest |
| LLC INTERNATIONAL GRAIN COMPANY INN 7708525142 Moscow 20.05.2004 | 1 813,8 | 47 696,0 | 26,7 | 3,80 | 195 The highest |
| LLC KRASNODARZERNOPRODUKT-EXPO INN 2310105350 Krasnodar territory 26.07.2005 | 131,0 | 19 564,0 | -11,5 | 0,67 | 235 High |
| LLC ZERNO-TREID INN 6154134277 Rostov region 14.07.2014 | 59,4 | 9 615,6 | 415,8 | 0,62 | 251 High |
| LLC GLENKOR AGRO KUBAN INN 2310093506 Krasnodar territory 28.05.2004 | 82,0 | 14 634,4 | 46,9 | 0,56 | 194 The highest |
| LLC AGROMARKET INN 2607017369 Stavropol territory 03.03.2004 | 31,1 | 8 587,7 | 32,4 | 0,36 | 206 High |
| LLC LIMITED LIABILITY MZK-ROSTOV INN 6164230188 Rostov region 12.01.2005 | 28,6 | 8 308,6 | 20,7 | 0,34 | 204 High |
| LLC YUZHNYI TSENTR INN 6167068896 Rostov region 08.08.2003 | 11,7 | 9 166,1 | 32,5 | 0,13 | 216 High |
| LLC ZERNOSOYUZ INN 5260226680 Rostov region 23.05.2008 | 1,4 | 10 317,5 | 16,0 | 0,01 | 236 High |
| LLC GRAVIT INN 7710964877 Moscow 03.07.2014 | -19,2 | 10 932,0 | 275,3 | -0,18 | 327 Satisfactory |
| Total for TOP-10 companies | 2 763,6 | 154 703,6 | |||
| Total for TOP-100 companies | 4 444,1 | 312 725,6 | |||
| Average for TOP-10 companies | 276,4 | 15 470,4 | 1,02 | ||
| Average for TOP-100 companies | 44,4 | 3 127,3 | 1,06 | ||
| Average for the industry | 0,3 | 177,2 | 0,19 |
The average of sales profit ratio in 2015 in the TOP-10 and TOP-100 groups is higher than the practical value (marked with green and yellow filling, correspondingly, in the Table 1 and Picture 1).
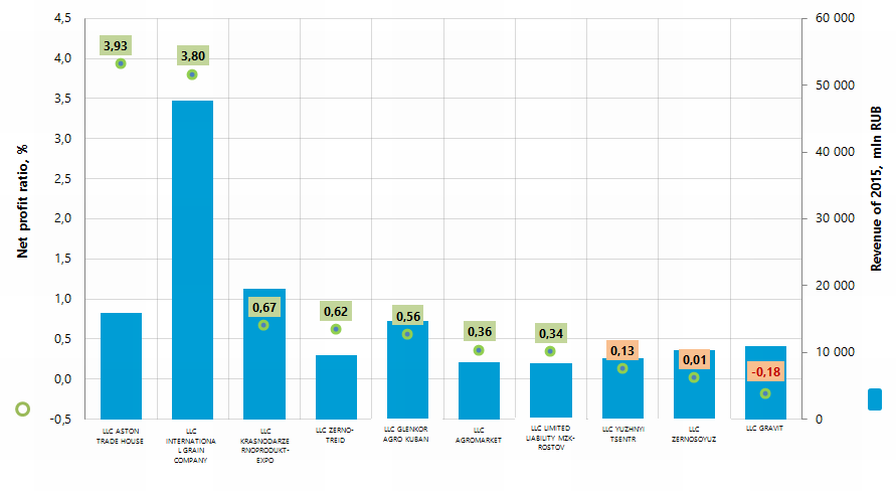 Picture 1. Net profit ratio and revenue of the largest Russian enterprises of grain wholesale (TOP-10)
Revenue volume of the 10 largest companies in 2015 was 49% of the total revenue in the industry. This demonstrates relatively high level of monopolization in the industry. Besides, revenue volume of the largest companies in the industry belonging to the International grain company group (LLC INTERNATIONAL GRAIN COMPANY, LLC GLENKOR AGRO KUBAN , LIABILITY MZK-ROSTOV) was 23% of the total revenue of the 100 largest companies (Picture 2).
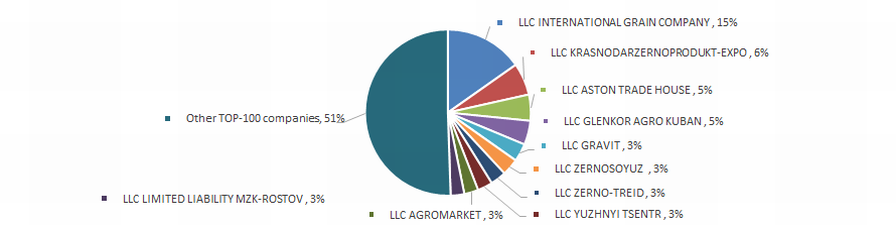 Picture 2. Shares of the TOP-10 companies in the total revenue of 2015 of the TOP-100 group, %
Nine out of TOP-10 companies have got the highest or high solvency index Globas®, that shows their ability to pay the debts in time and fully.
LLC GRAVIT has got satisfactory solvency index Globas® because of the information about the participation as a defendant in arbitration court proceedings in terms of debt collection and loss in the balance sheets. Projected growth of the index is stable.
Three companies out of TOP-10 in 2015 decreased their indicators of revenue or net profit compared to the previous period (marked with red filling in the Table 1).
In the TOP-100 group in 2014 10 loss-making companies were observed, in 2015 their amount decreased to 6. Besides, average loss 83% decreased. For other TOP-100 companies average profit almost 2,5 times increased (Picture 3).
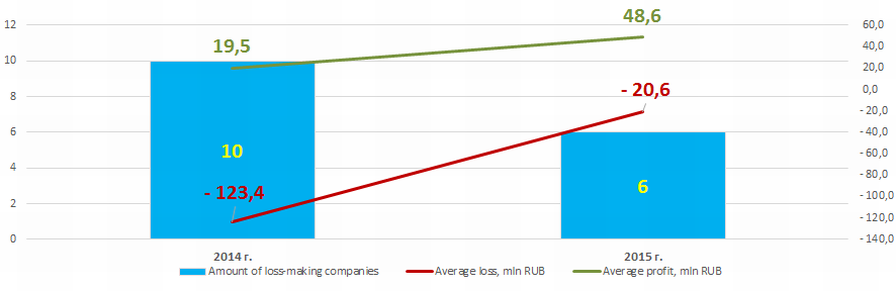 Picture 3. Amount of loss-making companies and their average loss, average profit in the TOP-100 companies in 2014 – 2015.
Dynamics of the industrial ratios of net profit (Picture 4) shows macroeconomic situation in the country in general.
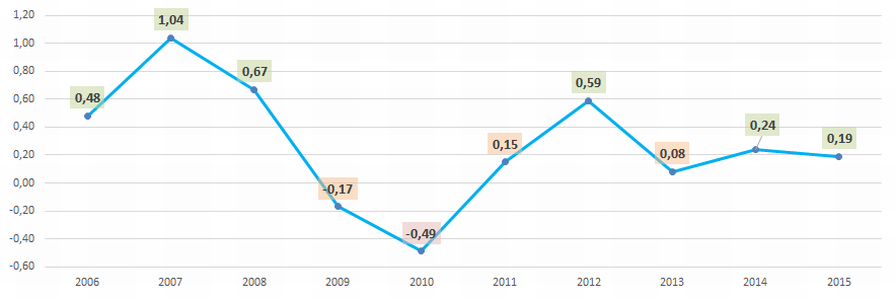 Picture 4. Average industrial values of the net profit ratio of the largest Russian enterprises of grain wholesale in 2006 – 2015
 Indicators of the industry in monetary terms in general also show macroeconomic tendencies with correction to peculiar dependence of grain market on weather conditions that is confirmed by the data of the Federal State Statistics Service (Picture 5 and Table 2).
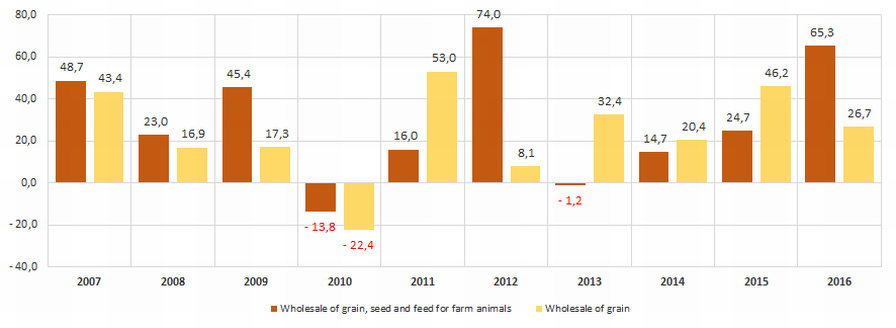 Picture 5. Rates of increase (decrease) in revenue from grain wholesale in monetary terms, year to year, %
For the last 10 years the highest revenue volume on grain wholesale was observed in 2016. (Table 2).
| 2007 | 2008 | 2009 | 2010 | 2011 | 2012 | 2013 | 2014 | 2015 | 2016 | |
| Wholesale of grain, seed and feed for farm animals | 80,9 | 99,5 | 144,7 | 124,8 | 144,8 | 252,0 | 248,9 | 285,5 | 356,0 | 588,3 |
| Wholesale of grain | 68,4 | 79,9 | 93,7 | 72,7 | 111,2 | 120,2 | 159,1 | 191,6 | 280,1 | 354,9 |
*) in the Table 2 decrease in wholesale volume is marked with red filling and increase in wholesale volume with green one
Besides, according to the Ministry of Agriculture of the RF, grain gross collection has an increasing tendency (Table 3).
| Type of agricultural crop | 2012 | 2013 | 2014 | 2015 |
| Grain and leguminous crops – total | 70 908 | 92 385 | 105 315 | 104 786 |
| Grain and leguminous crops – total, increase (decrease) year to year, % | 30,3 | 14,0 | -0,5 | |
| including: | ||||
| winter and spring wheat | 37 720 | 52 091 | 59 711 | 61 786 |
| winter and spring rye | 2 132 | 3 360 | 3 281 | 2 087 |
| grain maize | 8 213 | 11 635 | 11 332 | 13 173 |
| millet | 334 | 419 | 493 | 572 |
| buckwheat | 797 | 834 | 662 | 861 |
| rice | 1 052 | 935 | 1 049 | 1 110 |
| leguminous | 2 174 | 2 038 | 2 196 | 2 357 |
*) in the Table 3 decrease in agriculture crops collection volume is marked with red filling and increase is marked with green one
Probably, for this reason growing interest of business for wholesale grain market is observed recently. This can be illustrated by the data from the Information and Analytical system Globas® , according to that 37% companies of the 100 largest in terms of revenue volume for 2015 were founded in 2013 – 2014 (Picture 6).
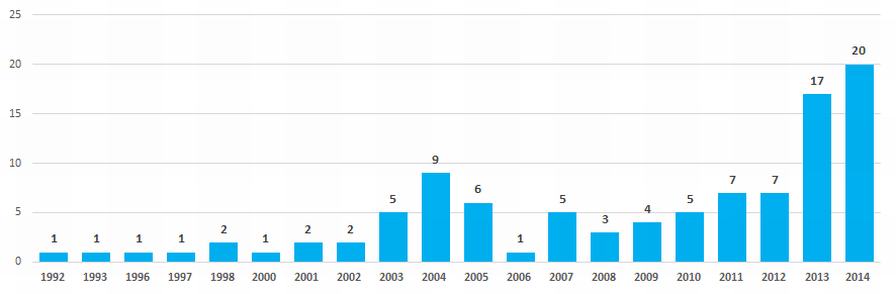 Picture 6. Distribution of the 100 largest Russian wholesale grain companies in terms of years of foundation.
Wholesale grain enterprises are distributed through the territory of the country irregularly, with maximum concentration on regions having favourable environment for grain cultivation. This is confirmed by the data from the Information and analytical system Globas®, according to that 100 largest companies with the highest revenue volume for 2015 are registered only in 20 regions of Russia (Picture 7).
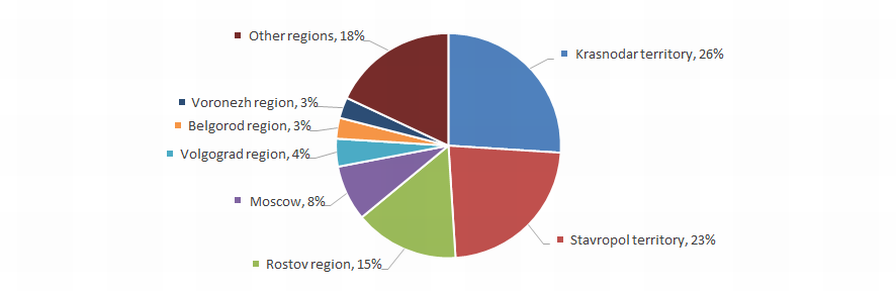 Picture 7. Distribution of the 100 largest grain wholesale enterprises through regions of Russia