Online loans for small businesses
According to the Federal State Statistics Service data, the share of small and medium-sized businesses in Russia’s GDP amounted to 21.9% in 2017. More recent data has not been published yet.
The development of small businesses directly depends on the financing sources. Getting loans is a very complicated procedure for small business. It often happens that the bank credit programs for start-up entrepreneurs are inaccessible due to strict requirements and lack of collateral; they also are too expensive due to high loan rates.
The alternative to bank loans is non-bank lending, the market of which is growing rapidly. Thus, according to the Central Bank of Russia data, the general growth of small businesses lending in 2017 amounted to 15% in comparison with 2016. In 2018, the growth amounted to 11% compared to the previous year.
There are government programs to support and subsidize business and new serious players. Government programs appear to support and subsidize business, as well as new serious players. Banks, in turn, are also creating alternative platforms for financing small businesses.
The development of non-bank lending is also facilitated by the growing financial technologies industry, which helps to get rid of paperwork; save time on visiting banks and receive money in the shortest period.
Further growth of alternative crediting of small business in Russia is predicted.
Under Russian laws, currently the only legal way of non-bank lending of small businesses and entrepreneurship is a microfinance activity. The legal basis of microfinance activity is determined by the Federal Law №151-FZ dated 02 July 2010 «On microfinance activities and microfinance organization». The same law regulates the size, procedure and conditions for granting microloans, the procedure for acquiring the status and activities of microfinance organizations as well as the rights and obligations of the Central Bank of the Russian Federation in this area.
In particular, the Central Bank of the Russian Federation registers the microfinance organizations (MFO) of entrepreneurial financing and maintains the relevant State register. As of 08.11.2019, 210 organizations are registered in the State register. Most of MFO have the relevant on-line services and usually provide loans only up to 100 or 300 thousand RUB. Some organizations offer larger amounts on the basis of assets availability, long-term cooperation and fair fulfillment of debt obligations by the borrower. The potential loan recipients need to meet the minimum requirements, such as:
- Russian citizenship;
- passport and permanent registration on the territory of the Russian Federation;
- age over 18 years;
- provision of well-thought-out business plan;
- the presence of liquid assets and the absence of third-party debt obligations are desirable.
The advantages of applying to MFO:
- short term of collection and submission of necessary documents;
- microloan on business development could be obtained almost in a day of treatment with minimal document package;
- interest rates are maximally open, there are no additional fees, free service is available;
- approval of loan applications is very fast, usually within a day;
- availability of various options for cash withdrawal and repayment of debts (bank cards, payment terminals, E-money, mobile shops etc.).
Among main disadvantages of obtaining microloans in MFO are:
- often higher interest rates in comparison with interest rates of banks;
- limited maximum loan amounts;
- short terms of borrowing.
Among main financing sources of MFO are:
- acceptance of deposits from the population (the minimum deposit from an individual is 1.5 million RUB);
- bond loans (used only by the largest MFO);
- attraction of foreign funds financing (extremely rare);
- raising of funds in cooperation with banks (on the basis of MFO affiliation with a particular bank);
- attraction of private Russian capital (main for 70% of MFO).
According to the Information and Analytical system Globas, currently there are more than 1800 active microfinance and microcredit companies in Russia.
Information about these companies and their activities is available for Globas users.
Аgro industrial enterprises of the North Caucasian Federal District of Russia
Information agency Credinform has observed trends in the activity of the largest enterprises of the NCFD of Russia.
Enterprises with the largest volume of annual revenue (TOP-1000) were selected for the analysis, according to the data from the Statistical Register for the latest available periods (for 2013-2018). The analysis was made on the basis of the data of the Information and Analytical system Globas.
Net assets is an indicator, reflecting the real value of company's property, is calculated annually as the difference between assets on the enterprise balance and its debt obligations. The indicator of net assets is considered negative (insufficiency of property), if company’s debt exceeds the value of its property.
The largest company in the NCFD in terms of net assets amount is LLC STAVROPOLSKIY BROILER, INN 2623030222, Stavropol territory. In 2018 net assets of the enterprise amounted to 9,4 billion RUB.
LLC ANDROPOVSK AGROPROJECT, INN 2603010073, Stavropol territory, had the smallest amount of net assets in the TOP-1000 group. Insufficiency of property of the company in 2018 was expressed in negative value -339 million RUB.
For a five-year period average amount of net assets of TOP-1000 companies has increasing tendency (Picture 1).
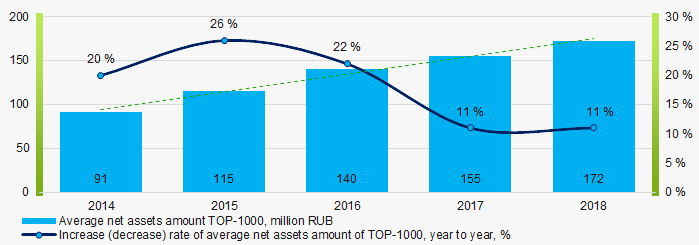 Picture 1. Change in average indicators of the net asset amount of TOP-1000 companies in 2014 – 2018
Share of companies with insufficiency of property in the TOP-1000 has increasing tendency for the last five years (Picture 2).
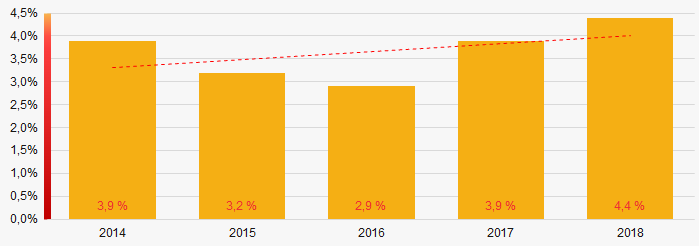 Picture 2. Shares of companies with negative values of net assets in TOP-1000 companies
Sales revenue
The revenue volume of 10 leaders of the industry made almost 32% of the total revenue of TOP-1000 companies in 2018 (Picture 3). It demonstrates relatively high level of competition in the industry in the NCFD.
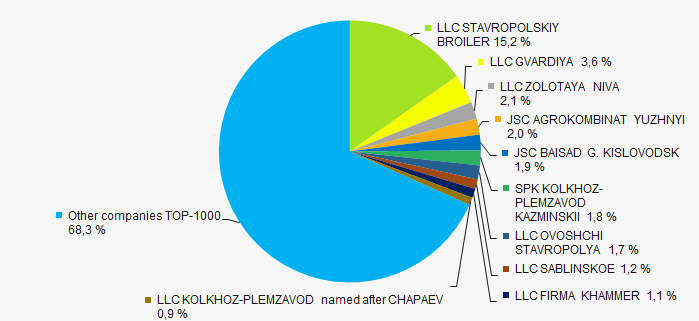 Picture 3. Shares of participation of TOP-10 companies in the total revenue of TOP-1000 companies for 2018
In general, an increasing tendency in revenue volume is observed (Picture 4).
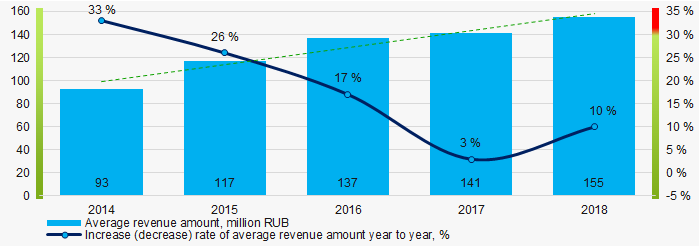 Picture 4. Change in the average revenue of top-1000 enterprises in 2014 – 2018
Profit and losses
The largest company in terms of net profit amount is LLC GVARDIYA, INN 2611007356, Stavropol territory. Following the results of 2018, the profit amounted to 2 billion RUB.
In general, for the last five years average indicators of net profit for TOP-1000 group have an increasing tendency (Picture 5).
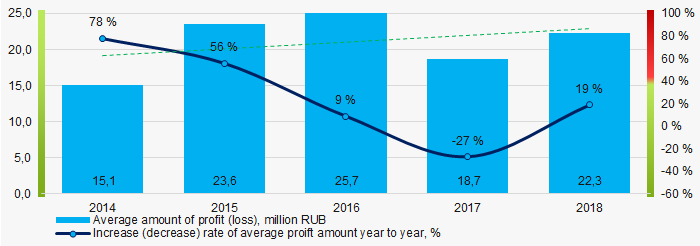 Picture 5. Change in the average indicators of net profit of TOP-1000 companies in 2014 – 2018
Over a five-year period, the average values of net profit indicators of TOP-1000 companies tend to increase. Besides, the average value of net loss increases (Picture 6).
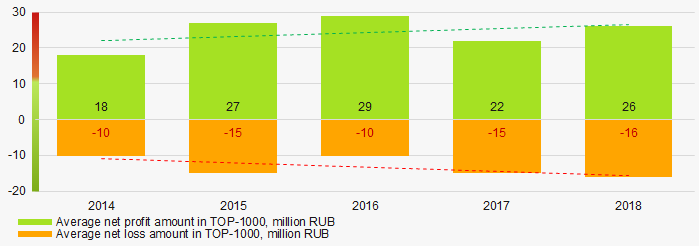 Picture 6. Change in the average indicators of net profit and loss of TOP-1000 companies in 2014 – 2018
Key financial ratios
Over the five-year period the average indicators of the current liquidity ratio of TOP-1000 in general were within the range of recommended values – from 1,0 up to 2,0 with decreasing tendency (Picture 7).
The current liquidity ratio (the relation of the amount of current assets to short-term liabilities) shows the sufficiency of company’s funds for repayment of its short-term liabilities.
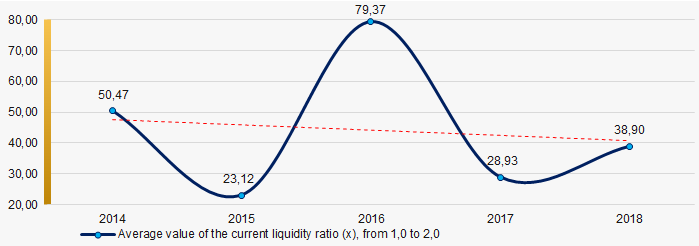 Picture 7. Change in the average values of the current liquidity ratio of TOP-1000 companies in 2014 – 2018
High level of the average values of the indicators of the return on investment ratio with increasing tendency have been observed for five years (Picture 8).
The ratio is calculated as the relation of net profit to the sum of own capital and long-term liabilities and demonstrates the return on the equity involved in the commercial activity of own capital and the long-term borrowed funds of an organization.
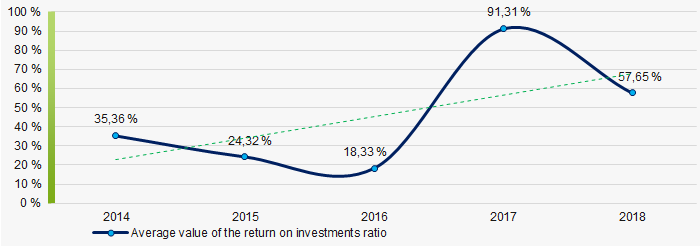 Picture 8. Change in the average values of the return on investment ratio of TOP-1000 companies in 2014 – 2018
Asset turnover ratio is calculated as the relation of sales revenue to the average value of total assets for a period and characterizes the efficiency of use of all available resources, regardless of the sources of their attraction. The ratio shows how many times a year a complete cycle of production and circulation is made, yielding profit.
This business activity ratio showed a tendency to increase for a five-year period (Picture 9).
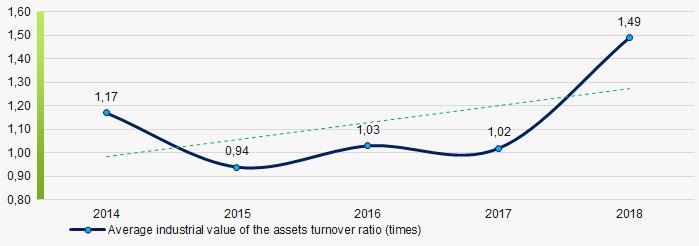 Picture 9. Change in the average values of the assets turnover ratio of TOP-1000 companies in 2014 – 2018
Small business
69% of the TOP-1000 companies are registered in the Register of small and medium enterprises of the Federal Tax Service of Russia. Besides, share of revenue in the total volume is more than 43%, that is almost twice higher than the average indicator countrywide (Picture 10).
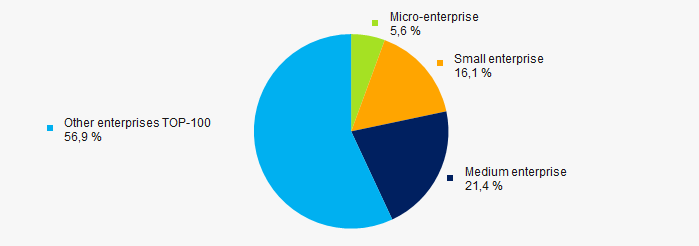 Picture 10. Shares of small and medium enterprises in TOP-1000 companies
Main regions of activity
TOP-1000 enterprises that registered in 7 regions of the federal district and are unequally distributed along the territory. Almost 86% are located in Stavropol territory (Picture 11).
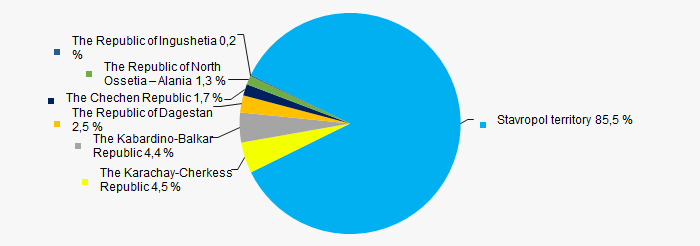 Picture 11. Distribution of revenue TOP-1000 companies by regions of the NCFD
Financial position score
An assessment of the financial position of TOP-1000 companies shows that the largest number is in an average financial position. (Picture 12).
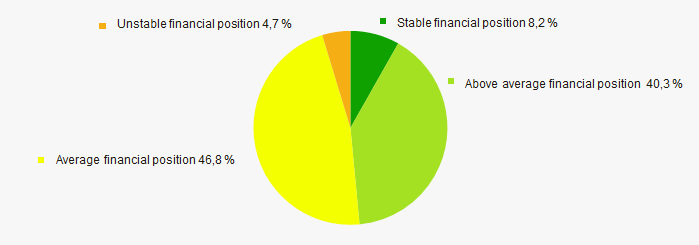 Picture 12. Distribution of TOP-1000 companies by financial position score
Solvency index Globas
Most of TOP-1000 companies have got from Medium to Superior Solvency index Globas, that points to their ability to repay their debts in time and fully (Picture 13).
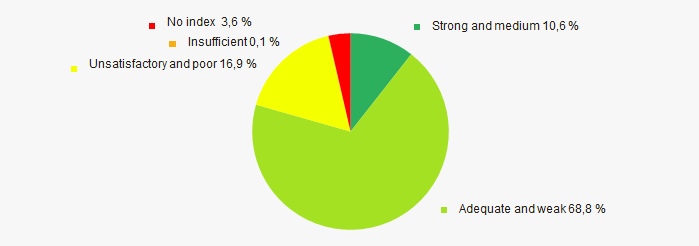 Picture 13. Distribution of TOP-1000 companies by solvency index Globas
Conclusion
Comprehensive assessment of the activity of the largest enterprises of the NCFD of Russia, taking into account the main indexes, financial indicators and ratios, demonstrates the presence of favorable trends (Table 1).
| Trends and assessment factors | Share of factor, % |
| Rate of increase (decrease) of average amount of net assets |  10 10 |
| Increase / decrease of share of companies with negative values of net assets |  -10 -10 |
| Level of competition/monopolization |  10 10 |
| Increase (decrease) rate of average revenue amount |  10 10 |
| Increase (decrease) rate of average net profit (loss) amount |  10 10 |
| Increase / decrease of average net profit amount of TOP-1000 companies |  10 10 |
| Increase / decrease of average net loss amount of TOP-1000 companies |  -10 -10 |
| Increase / decrease of average industrial values of the current liquidity ratio |  -10 -10 |
| Increase / decrease of average industrial values of the return on investments ratio |  10 10 |
| Increase / decrease of average industrial values of the assets turnover ratio, times |  10 10 |
| Share of small and medium enterprises in the industry in terms of revenue volume more than 22% |  10 10 |
| Regional concentration |  -10 -10 |
| Financial position (major share) |  10 10 |
| Solvency index Globas (major share) |  10 10 |
| Average value of factors |  3,9 3,9 |
 positive trend (factor),
  negative trend (factor).