TOP 1000 of the largest companies in Chelyabinsk
Information agency Credinform represents a review of activity trends among the companies in Chelyabinsk.
The largest companies with the highest annual revenue (TOP 1000) were selected for the ranking, according to the data from the Statistical Register and the Federal Tax Service for the latest available periods (2016 – 2020). The selection and analysis of companies were based on the data of the Information and Analytical system Globas.
Net assets are total assets less total liabilities. This indicator reflects the real value of the property of an enterprise. When the company’s debt exceeds the value of its property, the indicator is considered negative (insufficiency of property).
The largest company in term of net assets is JSC CHELYABINSK METALLURGICAL PLANT, INN 7450001007, production of cast iron, steel and ferroalloys. n 2020, net assets value of the company exceeded 54 billion RUB.
The lowest net assets value among TOP 1000 belonged to LLC OTELSTROY, INN 7451264986, activities of hotels and other places for temporary residence. In 2020, insufficiency of property of the enterprise was indicated in negative value of -1,7 billion RUB.
Covering the five-year period, the average net assets values of TOP 100 have a trend to increase with the decreasing growth rate (Picture 1).
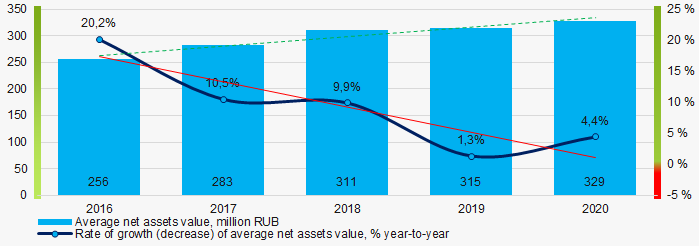 Picture 1. Change in average net assets values in 2016 – 2020
Over the past five years, the share of companies with insufficient property had a positive trend to decrease (Picture 2).
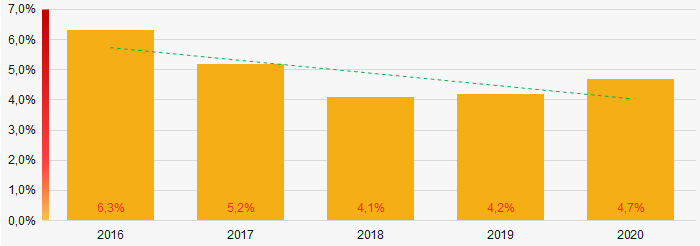 Picture 2. Shares of TOP 1000 companies with negative net assets value in 2016-2020
Sales revenue
In 2020, the revenue volume of ten largest companies was about 40% of total TOP 1000 revenue (Picture 3). This is indicative of a relatively high level of capital concentration among companies in Chelyabinsk.
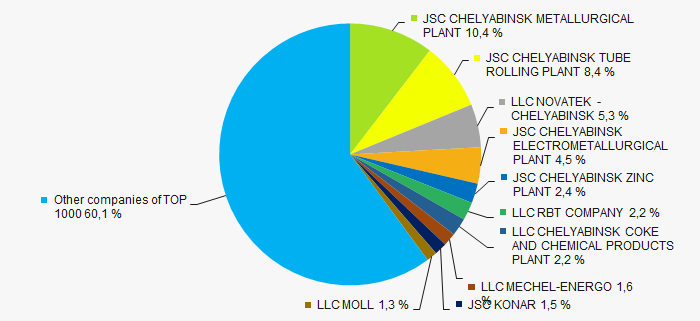 Picture 3. The share of TOP 10 companies in total 2020 revenue of TOP 1000
 In general, there is a trend to increase in revenue with the decreasing growth rate (Picture 4).
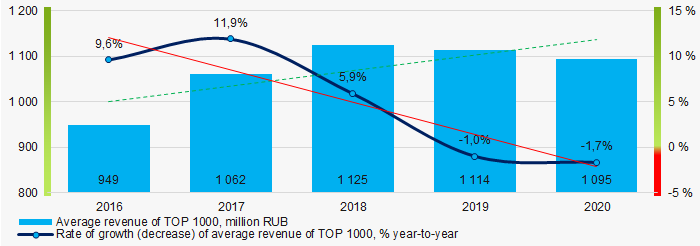 Picture 4. Change in average revenue in 2016 – 2020
Profit and loss
In 2020, the largest organization in term of profit was JSC CHELYABINSK TUBE ROLLING PLANT, INN 7449006730, production of steel pipes, hollow sections and fittings. The company’s profit almost exceeded 24 billion RUB. Covering the five-year period, there is a trend to decrease in average net profit and growth rate (Picture 5).
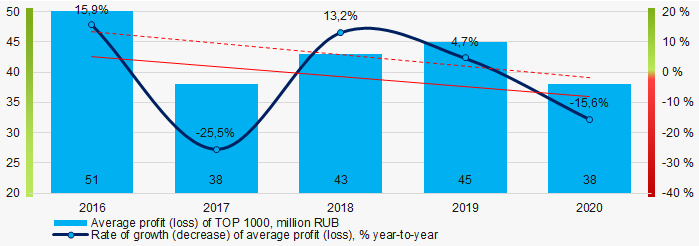 Picture 5. Change in average profit (loss) values of TOP 1000 in 2016 – 2020
For the five-year period, the average profit of TOP 1000 have the decreasing trend with the increasing net loss (Picture 6).
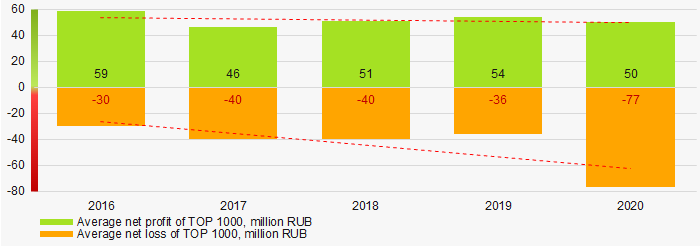 Picture 6. Change in average net profit and net loss of ТОP 1000 in 2016 - 2020
Key financial ratios
Covering the five-year period, the average values of the current liquidity ratio were above the recommended one - from 1,0 to 2,0 with a trend to increase (Picture 7).
Current liquidity ratio (current assets to short-term liabilities) shows the sufficiency of company’s assets to repay on short-term liabilities.
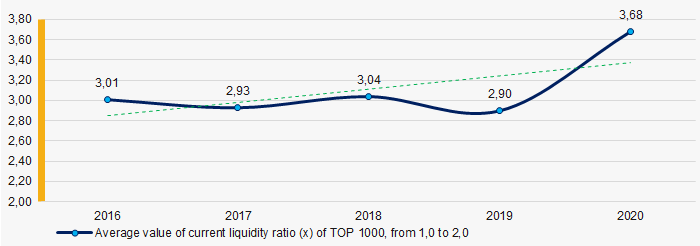 Picture 7. Change in industry average values of current liquidity ratio of TOP 1000 in 2016 – 2020
Covering the five-year period, the average values of ROI ratio had a trend to decrease (Picture 8).
ROI ratio is calculated as net profit to sum of shareholders equity and long-term liabilities, and shows the return of equity involved in commercial activities and long-term borrowed funds.
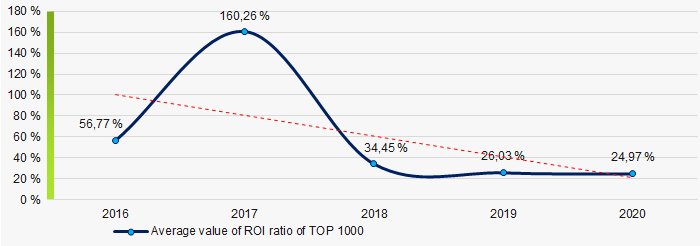 Picture 8. Change in industry average values of ROI ratio of TOP 1000 in 2016 - 2020
Assets turnover ratio is the ratio of sales revenue and company’s average total assets for a period. It characterizes the effectiveness of using of all available resources, regardless the source of their attraction. The ratio shows how many times per year the full cycle of production and circulation is performed, generating the corresponding effect in the form of profit.
Covering the five-year period, business activity ratio demonstrated the decreasing trend (Picture 9).
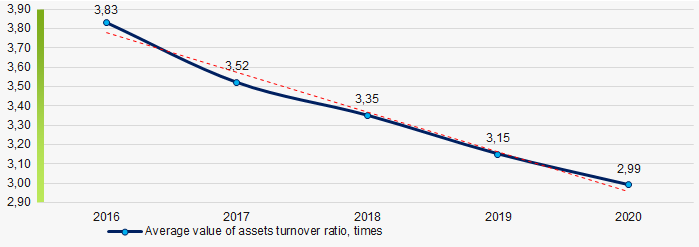 Picture 9. Change in average values of assets turnover ratio of TOP 1000 in 2016 – 2020
Small business
84% of companies of TOP 1000 are registered in the Register of small and medium-sized enterprises of the Federal Tax Service of the Russian Federation. In 2020, their share in total revenue of TOP 1000 is 28%, higher than the average country values in 2018-2019 (Picture 10).
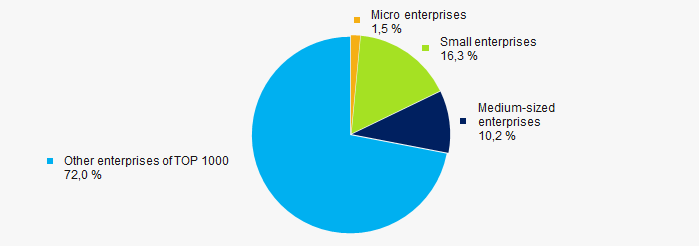 Picture 10. Shares of small and medium-sized enterprises in TOP 1000
Financial position score
Assessment of the financial position of TOP 1000 companies shows that the financial position of the majority of them is above average (Picture 11).
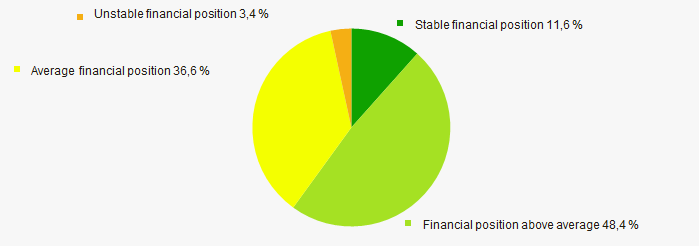 Picture 11. Distribution of TOP 1000 companies by financial position score
Solvency index Globas
Most of TOP 1000 companies got Superior / High and Strong / Medium indexes Globas. This fact shows their limited ability to meet their obligations fully (Picture 12).
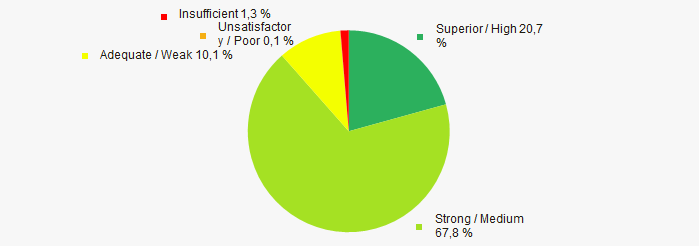 Picture 12. Distribution of TOP 1000 companies by solvency index Globas
Conclusion
Complex assessment of activity of largest companies in Chelyabinsk, taking into account the main indexes, financial ratios and indicators, demonstrates the prevalence of negative trends in their activities in 2016 - 2020 (Table 1).
| Trends and evaluation factors | Relative share of factors, % |
| Dynamics of the average net assets value |  10 10 |
| Rate of growth (decrease) in the average size of net assets |  -10 -10 |
| Increase (decrease) in the share of enterprises with negative values of net assets |  10 10 |
| Level of competition / monopolization |  -5 -5 |
| Dynamics of the average revenue |  10 10 |
| Rate of growth (decrease) in the average size of revenue |  -10 -10 |
| Dynamics of the average profit (loss) |  -10 -10 |
| Rate of growth (decrease) in the average profit (loss) |  -10 -10 |
| Growth / decline in average values of companies’ net profit |  -10 -10 |
| Growth / decline in average values of companies’ net loss |  -10 -10 |
| Increase / decrease in average values of total liquidity ratio |  5 5 |
| Increase / decrease in average values of return on investment ratio |  -10 -10 |
| Increase / decrease in average values of asset turnover ratio, times |  -10 -10 |
| Share of small and medium-sized businesses in terms of revenue being more than 20% |  10 10 |
| Financial position (the largest share) |  10 10 |
| Solvency index Globas (the largest share) |  10 10 |
| Average value of relative share of factors |  -1,3 -1,3 |
 positive trend (factor),
  negative trend (factor)
Shadow economy
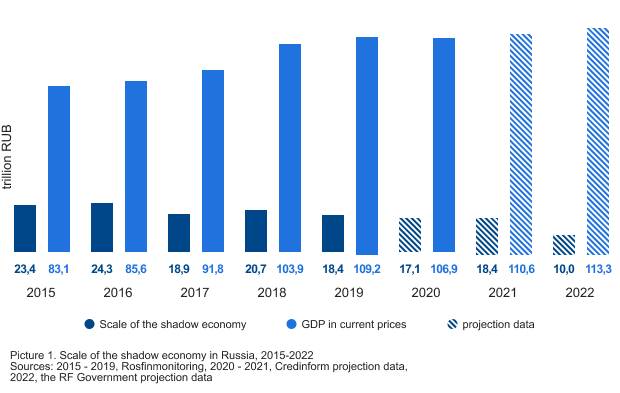
The shadow sector of the Russian economy has been shrinking over the past few years. By 2022, the Government of the Russian Federation predicts a decrease in the volume of the shadow economy to 10 trillion RUB, about 9% of the forecasted value of GDP for 2022. For comparison, the total revenue of the three largest enterprises in Russia in 2020 is 10,7 trillion RUB - JSC Gazprom (4,1 trillion RUB), JSC Oil Company Rosneft (4,8 trillion RUB), JSC Russian Railways (1,8 trillion RUB).
Does the Russian economy have a chance to step out of the shade?
The shadow sector exists in the economy of any country. Tax evasion, criminal income, understatement of the size of business take place even in financially prosperous states. The scale of the shadow economy is crucial. The greater its share in GDP and the citizens employed in it, the less budget revenues, the weaker the economy, and the higher the risks of economic security.
How big is the Russia’s shadow economy?
Despite the downward trend, the volume of the hidden economy in Russia is quite large. According to the Federal Service for Financial Monitoring of the Russian Federation (Rosfinmonitoring), the shadow sector is estimated at about 18,4 trillion RUB, 16,9% of Russia's GDP (Picture 1). The volume of shadow activity in the Russian Federation is practically comparable to the federal budget revenues. In particular, revenues amounted to about 20,3 trillion RUB in 2020.
In 2015-2017, the growth of the gray economy stopped and its share in total GDP began to decline. Russian business has adapted to the sanctions, and domestic production has been adjusted within the framework of the import substitution policy. However, in 2018, the next round of the crisis brought tangible discomfort to a number of the country's leading industries, provoked an outflow of foreign assets from Russia and the growth the share of the shadow economy.
Prospects to step out of the shade
The measures taken by the Government for deoffshorization, combating illegal income, and control over monetary transactions are yielding positive results. According to the Central Bank, the volume of shady transactions in the banking sector in 2020 decreased by 26%, which will undoubtedly affect the “lightness” of the economy.
According to Credinform experts, the share of the shadow economy will decrease due to the growth of Russia's GDP, but its volume will remain quite high: in 2021, it may return to the value of 2019, reaching 18,4 trillion RUB. (Picture 1).
Forced restriction of business activity in 2020-2021 negatively affected a number of industries in Russia. The increase in additional employee costs during the period of restrictions prompted many entrepreneurs to go into the shadows and conduct uncontrolled economic activities.
Reducing the shadow sector depends on a competent solution to the problems of Russian entrepreneurs, not only tightening measures against unreliable and shell companies, but also stimulating business development, including through a fair reduction in the tax burden.