
Order a report
Custom-made industry research, company ratings, competitor analysis


Activity trends of Samara companies
Information Agency Credinform presents a review of activity trends of the largest real economy companies of the Samara region. The companies from the Samara region with the highest volume of annual revenue (TOP-10 and TOP-1000) have been selected for the analysis, according to the data from the Statistical Register for the latest available accounting periods (2012 — 2017). The analysis was based on the data from the Information and Analytical system Globas.
Net assets indicate fair value of corporate assets that is calculated annually as assets on balance less company’s liabilities. Net assets value is negative (insufficiency of property) if liabilities are larger than the property value.
| № | Name, INN, type of activity |
Net assets value, billion RUB |
Solvency index Globas | ||||
| 2013 | 2014 | 2015 | 2016 | 2017 | |||
| 1 | 2 | 3 | 4 | 5 | 6 | 7 | 8 |
| 1 | PJSC Russian innovation fuel and energy company INN 7736036626 Crude petroleum extraction In process of reorganization in the form of transformation, since 30.07.2018 |
|
|
|
|
|
183 High |
| 2 | NJSC TRANSNEFT-PRIVOLGA INN 6317024749 Oil and oil products transportation via pipelines |
|
|
|
|
|
211 Strong |
| 3 | LLC LEVIT INN 6330030244 Investment in securities |
|
|
|
|
|
245 Strong |
| 4 | PJSC TOGLIATTIAZOT INN 6320004728 Manufacture of fertilizers and nitrogen compounds |
|
|
|
|
|
199 High |
| 5 | NJSC SAMARANEFTEGAS INN 6315229162 Extraction of crude petroleum |
|
|
|
|
|
184 High |
| 996 | NJSC Enterprise of Heating Networks (PTS) INN 6315530348 Distribution of steam and hot water (thermal energy) |
|
|
|
|
|
267 Medium |
| 997 | LLC World of Soft Toys INN 6321135890 Wholesale of games and toys Process of being wound up, since 24.01.2017 |
|
|
|
|
|
600 Insufficient |
| 998 | PJSC VOLGABURMASH INN 6314007329 Manufacture of machinery for mining and construction Process of being wound up, since 20.07.2016 |
|
|
|
|
|
600 Insufficient |
| 999 | PJSC VOLZHSKI OIL SHIPPING COMPANY VOLGOTANKER INN 6317019185 Sea freight water transport Process of being wound up, since 17.03.2008 |
|
|
|
|
|
600 Insufficient |
| 1000 | PJSC AVTOVAZ INN 6320002223 Manufacture of motor cars |
|
|
|
|
|
305 Adequate |
![]() — growth compared to prior period,
— growth compared to prior period, ![]() — decline compared to prior period.
— decline compared to prior period.
Average values of net assets of TOP-1000 companies tend to increase during the last 5 years. However, growth rate itself declines (Picture 1).
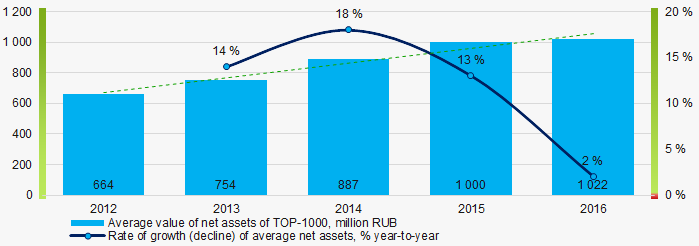 Picture 1. Change in average net assets value of TOP-1000 companies in 2012 — 2016
The share of TOP-1000 companies with insufficiency of property tends to increase within the last 5 years (Picture 2).
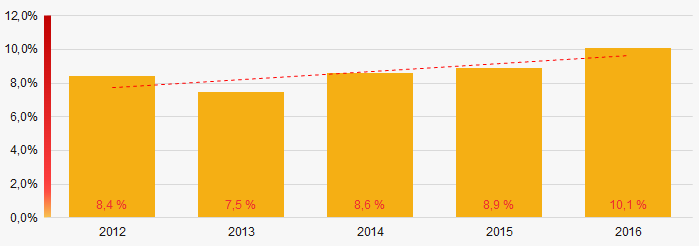 Picture 2. Share of TOP-1000 companies with negative value of net assets
 Sales revenue
In 2016 sales revenue of 10 regional industry leaders amounted to 41% of total revenue of TOP-1000 companies (Picture 3). This is an indicator of concentration of large companies in the Samara region.
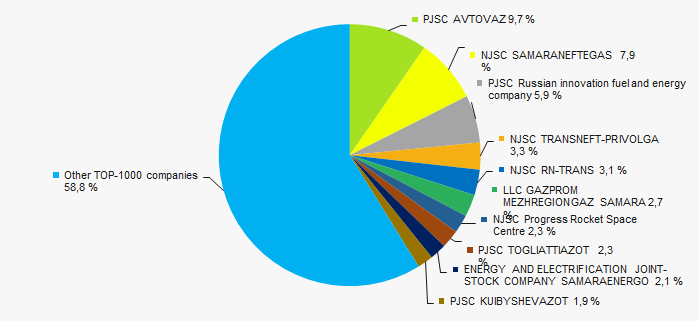 Picture 3. TOP-10 companies by their share in 2016 total revenue of TOP-1000 companies
In general, revenue tends to increase, and growth rate decreases (Picture 4).
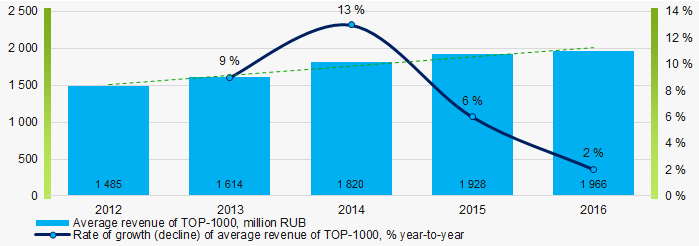 Picture 4. Change in average revenue of TOP-1000 companies in 2012 — 2016
Profit and loss
In 2016 profit of 10 regional industry leaders amounted to 76% of total profit of TOP-1000 companies (Picture 5).
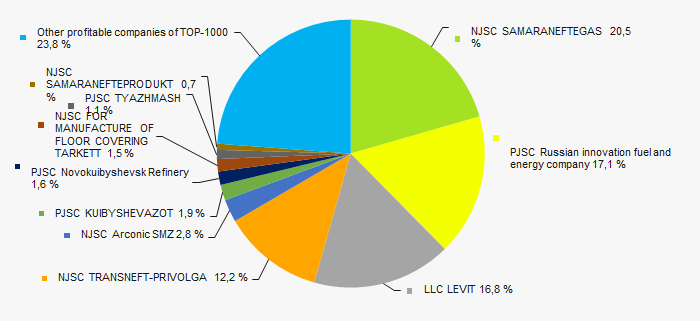 Picture 5. TOP-10 companies by their share in 2016 total profit of TOP-1000 companies
Average net profit values of TOP-1000 companies within the last 5 years tend to increase, as well as average loss value (Picture 6).
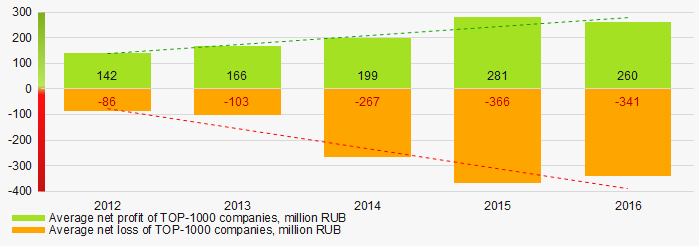 Picture 6. Change in average net profit and loss of TOP-1000 companies in 2012 — 2016
Key financial ratios
During the last 5 years average values of total liquidity ratio of TOP-1000 were above the recommended value — from 1,0 to 2,0, tending to grow (Picture 7).
Total liquidity ratio (a ratio of current assets to current liabilities) reveals the sufficiency of a company’s funds for meeting its short-term liabilities.
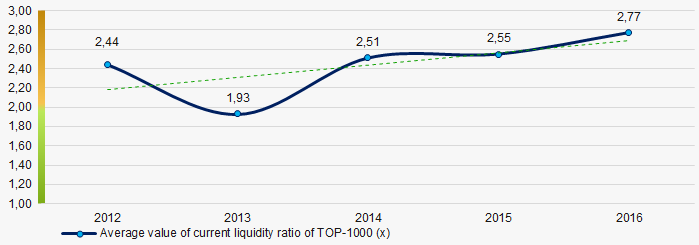 Picture 7. Change in average values of total liquidity ratio of TOP-1000 companies in 2012 — 2016
During the last 5 years average values of return on investment ratio tended to decrease (Picture 8).
It is a ratio of net profit to total equity and noncurrent liabilities, and it demonstrates benefit from equity engaged in business activity and long-term raised funds of the company.
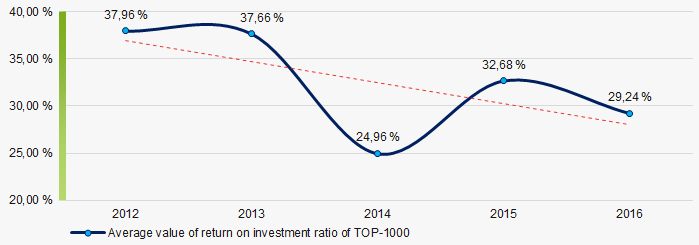 Picture 8. Change in average values of return on investment ratio of TOP-1000 companies in 2012 — 2016
Assets turnover ratio is a ratio of sales revenue to average total assets for the period, and it measures resource efficiency regardless of the sources. The ratio indicates the number of profit-bearing complete production and distribution cycles per annum.
During the last 5 years, this activity ratio tended to decrease (Picture 9).
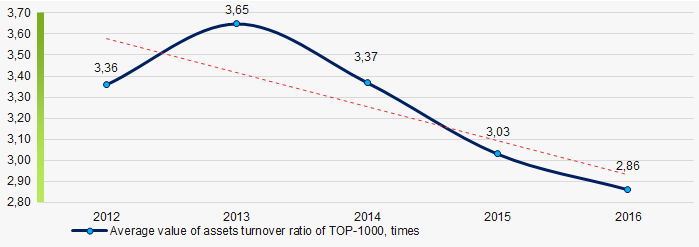 Picture 9. Change in average values of assets turnover ratio of TOP-1000 companies in 2012 — 2016
Activities structure
Crude petroleum extraction companies and manufacturers of motor vehicles have the largest share in total revenue of TOP-1000 companies (Picture 10).
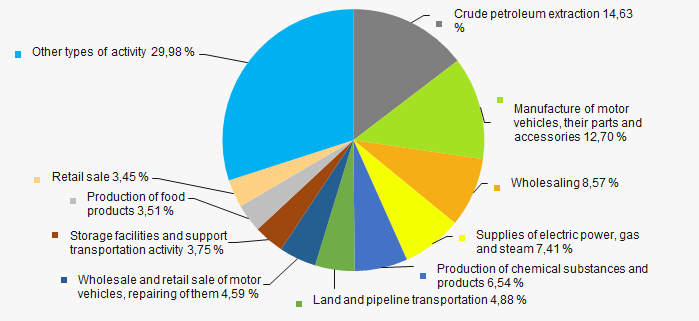 Picture 10. Types of activity by their share in total revenue of TOP-1000 companies
63% companies of TOP-1000 are included in the register of small and medium-sized businesses of the Federal Tax Service of the Russian Federation (Picture 11).
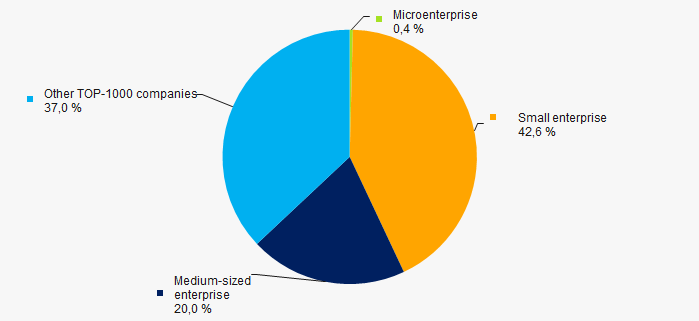 Picture 11. Shares of small and medium-sized enterprises in TOP-1000 companies
Financial position score
Assessment of financial state of TOP-1000 companies indicates that most of the companies have a stable and above average financial standing (Picture 12).
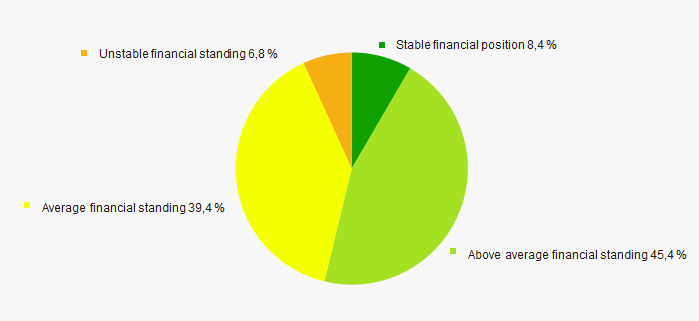 Picture 12. TOP-1000 companies by their financial position score
Solvency index Globas
The majority of TOP-1000 companies have got a superior, high, strong and medium Solvency index Globas, that indicates their capability to meet liabilities timely and in full (Picture 13).
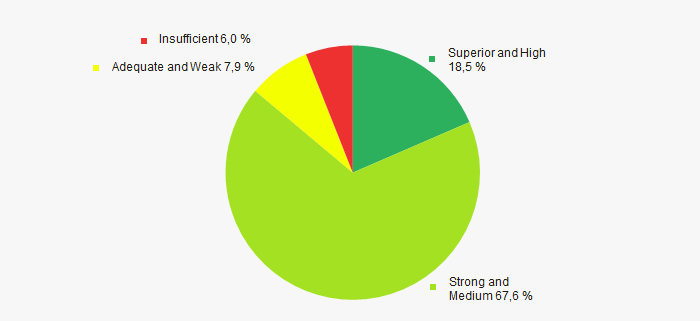 Picture 13. TOP-1000 companies by Solvency index Globas
 Conclusion
A comprehensive assessment of the largest real economy companies of the Samara region, that considers key indexes, financial figures and ratios, is indicative of predominance of positive trends within the sector, such as growing of net assets, sales revenue and net profit. However, decrease in average net assets' growth rate, increasing share of companies with insufficiency of funds, growing of net loss, decrease in return on investment and assets turnover ratios are the alarming factors.
According to the Federal State Statistics Service, in 2017 - 2018 the trend of some increase in indexes of industrial production is observed (Picture 14).
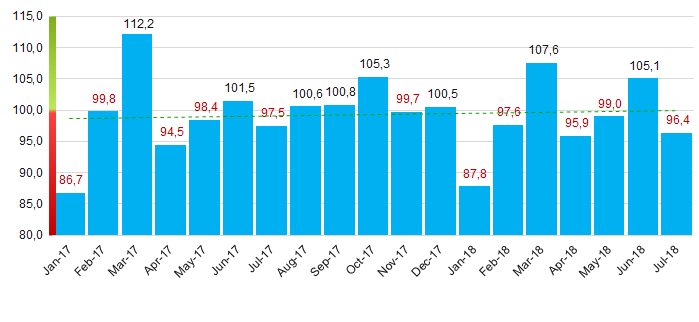 Picture 14. Index of industrial production in the Samara region, month-to-month (%)
 According to the same data, the share of the Samara region in all-Russian revenue from sales of goods, products and services amounted to 1.5% for 6 months of 2018.