Is there a future for small and medium-sized business?
Dear Madams and Sirs,
St. Petersburg Economic Forum will be held in Saint-Petersburg on 18th June 2015. One of the issue for discussion is “Small and medium-sized business as a driver of the Russian economy growth”. Shortly before the Forum, the experts of the Credinform information agency have analyzed the small and medium-sized business (SMB) dynamism in Russia and assessed its prospects.
In 2014 the total amount of SMB subjects (here and after excluding the individual entrepreneurs) has grown by 1,7% compared to 2013, and reached 2,1 mln, 88% whereas accounts for micro-enterprises, 11% for small and 1% for medium-sized enterprises.
On the 27th January 2015 the Government of the RF has enacted the crisis bailout plan of high priority measures aimed at sustainable economic development and social stability in the year of 2015. Within its frameworks it was suggested to double the value limit of sales revenue for counting the economic entities as SMB categories. This measure will undoubtedly influence the number of enterprises fall into small and medium-sized.
Despite of the Federal program of financial support for SMB acting in Russia since 2005, the share of these enterprises in the national economy is still low. As of the year 2014, the SMB share in the Russian GDP is 29,3%. As a comparison, this figure ranges from 40% to 70% in the EU countries, developed Asian countries and the USA. According to the conclusion of the Organisation for Economic Co-operation and Development (OECD), the countries with SMB share of 60-70% effectively overcome the crisis, than countries with lower share.
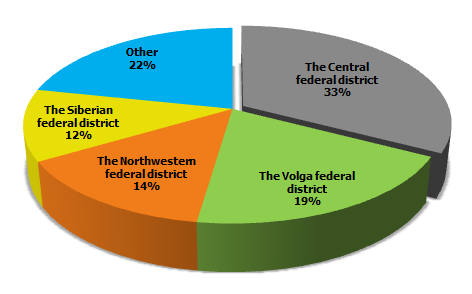
The experts also notice the high degree of SMB enterprises regional aggregation. For example, 33% of small business enterprises are located in the Central federal district, 19% of which accounts for Moscow and the Moscow region. This situation undoubtedly has a negative impact on the formation of regional budgets.

Figure 1. The scheme of SMB enterprises by the regions
17 bln. RUB will be distributed for SMB support within the frameworks of the Economic development and innovative economy program. The majority of funds will be send to the Moscow region (817 mln. RUB), the Krasnodar Territory (623 mln. RUB) and Saint-Petersburg (600 mln. RUB). It is expected that the federal money will increase the capitalization of regional SMB support programs.
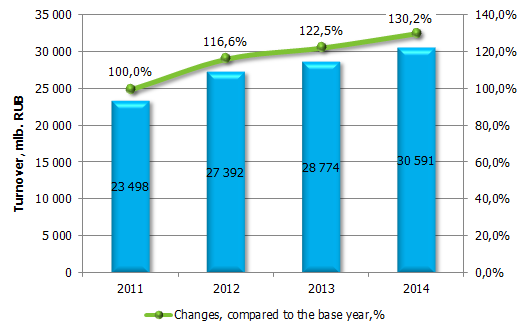
According to the Information and analytical System Globas-i®, the SMB total turnover amounted to 30,5 bln. RUB at 2014 year-end. More than a half (54,6%) accounts for small enterprises, 31,5% for micro-enterprises and 13,7% for medium-sized.

Figure 2. Turnover dynamics of SMB in Russia, mln. RUB
Sectorial specific nature of small and medium-sized business remains pretty much the same: the main lines of business are trade (32%) and services provision (19,6%), as well as processing industry (14,3%) and construction (12,3%).
The following problems, thwarting progress, should be noted: instability of the legislation in the field of tax and financial regulation, problems of access to funding sources, keeping of high level of administrative barriers, problems of finding sales markets, as well as low level of entrepreneurial activity among the population and a lack of qualified employees. Concerning tax legislation, the government has already prepared a proposal for a moratorium on imposing the new tax payments for the next three years. However, the situation with access to sources of finance is not so rosy firstly due to the almost blocking-off loans value. Loans for business remain unavailable. Perhaps, the Russian government in the near future will continue to take certain steps to support individual business sectors - in the form of subsidies or issuing guarantees.
As foreign experience shows, SMB companies can contribute in improvement of the socio-economic situation during the crisis, being a sort of “safety bag”. Under the stability they are able to provide an opportunity for the efficient economic growth. But the government should get the effective cooperation policy for realization of SMB potential. First of all, this policy should be aimed at integration of SMB enterprises in associations and unions, improvement of interaction with large business, as well as reduction of the administrative pressure.
For all information on enterprises, as well as subjects of small and medium-sized business and analytical reports on various economic sectors you can refer to our Custom Service Department specialists:
+7 (812) 406 8414 (Saint-Petersburg), +7 (495) 640 4116 (Moscow).
Isolation of Russia is canceled
Dear Madams and Sirs,
In spite of the significant cooling in relations with the Occident, EU states coalition remains the main foreign trade partner of Russia. 48,2% of trade in monetary terms (377,4 bln US Dollars) has fallen to its share in 2014. Remarkably, Russia is the third by importance for EU for that matter after China and the USA.
However, sanctions war and stagnation of the Russian economy have resulted in reduction of the total turnover value with EU by 9,6%.
In general, the trade volume of Russia with other countries amounted to 783,5 bln US Dollars in 2014, that is 7% lower than in 2013 (842,2 bln Dollars in 2013; maximum for the whole post-Soviet period). 239 countries and territories were involved in export-import operations with Russia.
Import for the period under review has reduced more than the Russian export: import by 9,2% and export by 5,6%. In monetary terms import amounted to 285,9 bln US Dollars, export to 497,6 bln US Dollars.
The main reason of import reduction was devaluation of the rouble in the whole 2014, as well as falling demand. It will be difficult to replace the drop-down import: devaluation and import falling during the 1998 crisis had speeded up domestic enterprises by means of previously unused capacities, but now this resource is limited.
Referring to the rating of the most important trade partners excluding commercial unions. China takes the first place (88,4 bln US Dollars), Netherlands takes the second (73,3 bln US Dollars), and Germany is the third (70,1 bln US Dollars).
External turnover with the neighboring Ukraine fell by 29,6% (to 27,9 bln US Dollars). The negative trend of indexes rapid reduction will clearly continue in 2015. Despite of imposed sanctions, trade with the USA has increased by 5,5% in 2014 (up to 29,2 bln US Dollars).
| № | Partner countries | Foreign trade volume of the RF for 2014, bln US Dollars | Increase (reduction) comparing to 2013, % | Share of external turnover to the total, % |
| Total | 783 453,7 | -7,0 | 100 | |
| EU | 377 390,5 | -9,6 | 48,2 | |
| 1 | China | 88 373,4 | -0,5 | 11,3 |
| 2 | Netherlands | 73 284,0 | -3,5 | 9,4 |
| 3 | Germany | 70 087,6 | -6,5 | 8,9 |
| 4 | Italy | 48 471,2 | -10,0 | 6,2 |
| 5 | Turkey | 31 620,3 | -3,4 | 4,0 |
| 6 | Belarus | 31 511,3 | -7,8 | 4,0 |
| 7 | Japan | 30 793,9 | -7,3 | 3,9 |
| 8 | USA | 29 146,2 | 5,5 | 3,7 |
| 9 | Ukraine | 27 862,3 | -29,6 | 3,6 |
| 10 | South Korea | 27 300,2 | 8,5 | 3,5 |
At the same time Russia has begun phased trade flow redistribution to Asian, African and Latin American countries. Among the main partner countries with total turnover of more than 3 bln dollars, Singapore is on top (see table 2) in term of its growth (+152,5% to 2013); Egypt takes the second place (+86%).
| № | Partner countries | Growth of foreign trade volume of the RF to 2013, % | Foreign trade volume, mln US Dollars |
| 1 | Singapore | 152,5 | 6 156,2 |
| 2 | Egypt | 86,0 | 5 478,7 |
| 3 | Denmark | 23,2 | 4 506,9 |
| 4 | Malaysia | 22,7 | 3 297,0 |
| 5 | Latvia | 19,8 | 13 450,4 |
| 6 | Thailand | 18,7 | 3 986,5 |
| 7 | Brazil | 15,7 | 6 335,5 |
| 8 | Azerbaijan | 12,0 | 4 009,1 |
| 9 | Estonia | 10,7 | 5 326,9 |
| 10 | Belgium | 8,8 | 12 798,7 |
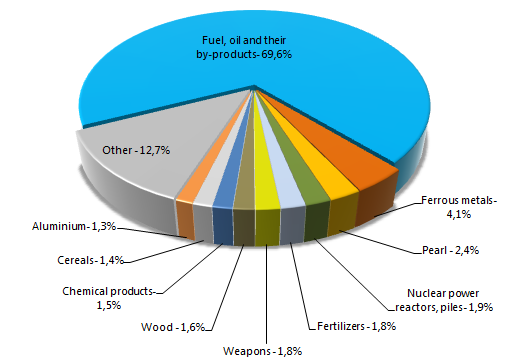
The structure of the Russian export remains uniform and is based on depleting resources. Excluding oil and gas the country imports ferrous metals (4,1% of total export in monetary terms), precious and semiprecious stones, pearl (2,4%), hi-tech equipment for nuclear power industry (1,9%), fertilizers (1,8%), weapons (1,8%), wood (1,6%), products of chemical industry (1,5%), cereals (1,4%), aluminum (1,3%) and other items (12,7%).

Figure 1. Structure of the Russian export in monetary terms, 2014, %
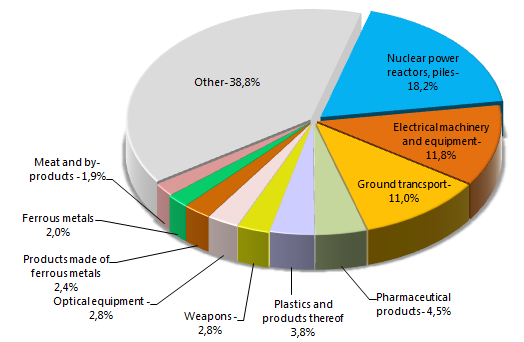
The structure of the Russian import is not so uniform. Russia purchases a wide range of products, mainly equipment for power industry (18,2% of total import in monetary terms), electrical machinery and equipment (11,8%), lorries and cars (11%), medicines (4,5%), plastics (3,8) and other (see figure 2).

Figure 2. Structure of the Russian import in monetary terms, 2014, %
According to the experts of the Credinform information agency, the reduction of foreign trade volume will continue next year, but as a temporary thing. Growth recovery in 2016 will be possible at exchange and economic climate stabilization and greater credit resources access. Today Russia finds new trade partners and discovers new markets, despite of external constraints. Isolation, being discussed by some Western countries’ leaders, doesn’t happen.
For all information on Russian and foreign enterprises, as well as analytical reports on various economic sectors you can refer to our Custom Service Department specialists:
+7 (812) 406 8414 (Saint-Petersburg), +7 (495) 640 4116 (Moscow).