
Order a report
Custom-made industry research, company ratings, competitor analysis


Activity trends of companies with UTII
Information agency Credinform presents a review of the activity trends of the companies with unified tax on imputed income.
The largest enterprises having ever paid the unified tax on imputed income in the period of its activity (TOP-1000) in terms of annual revenue were selected for the analysis according to the data from the Statistical Register and the Federal Tax Service for the period of 2014 – 2019 years. The analysis was based on the data from the Information and Analytical system Globas.
Net assets are total assets less total liabilities. This indicator reflects the real value of the property of an enterprise. When the company’s debt exceeds the value of its property, the indicator is considered negative (insufficiency of property).
The largest company with UTII in term of net assets was JSC BASHINFORMSVYAZ, INN 0274018377, Republic of Bashkortostan. In 2019, net assets value of the company amounted to more than 17,2 billion RUB.
The lowest net assets value among TOP-1000 was recorded for OOO LABIRINT, INN 7451241509, Penza region. The company is a part of retail chain under the trademark “KRASNOE, &, BELOE”. In 2019, insufficiency of property of the company was indicated in negative value of -1,4 billion RUB.
During six-year period, the average net assets values of TOP-1000 have a trend to increase, with decreasing growth rates (Picture 1).
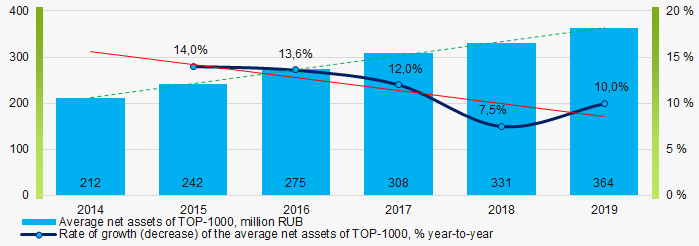 Picture 1. Change in average net assets value of TOP-1000 in 2014 – 2019
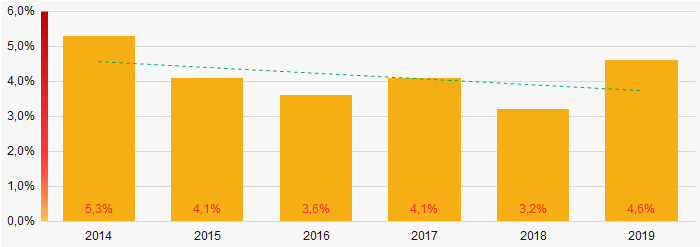
The shares of TOP-1000 companies with insufficient property had positive trend to for the past six years (Picture 2).
 Picture 2. Shares of companies with negative net assets value in TOP-1000 in 2014 – 2019
Sales revenue
The revenue volume of the ten leading companies amounted to 14% of the total revenue of TOP-1000 companies in 2019 (Picture 3). It gives evidence to relatively low level of the capital concentration among companies with UTII.
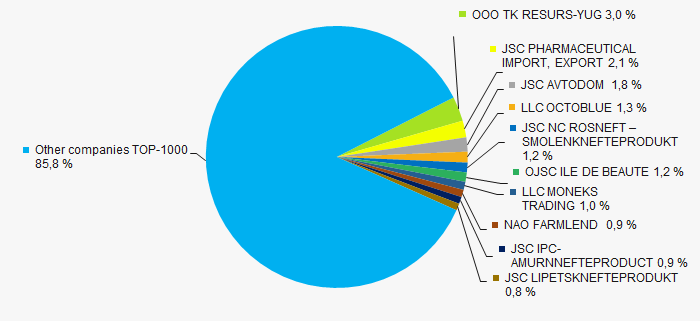 Picture 3. Shares of TOP-10 companies in the total revenue of TOP-1000 in 2019
In general, there is a trend to increase in revenue with increasing growth rates (Picture 4).
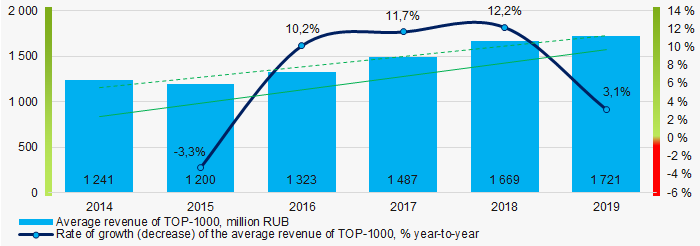 Picture 4. Change in average revenue in 2014– 2019
Profit and loss
The largest company in term of net profit is JSC BASHINFORMSVYAZ, INN 0274018377, Republic of Bashkortostan. The company’s profit exceeded 1,9 billion RUB in 2019.
During six-year period, the average profit figures of TOP-1000 companies have a trend to increase with increasing growth rates (Picture 5).
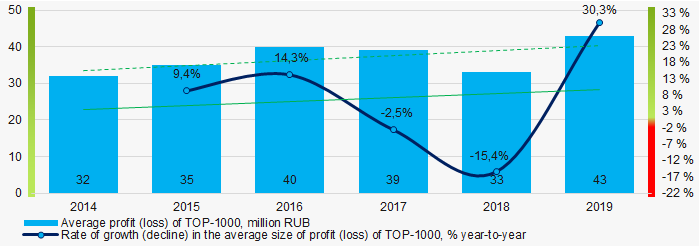 Picture 5. Change in average profit (loss) of TOP-1000 companies in 2014- 2019
During six-year period, the average net profit figures of TOP-1000 companies have a trend to increase with the increasing average net loss (Picture 6).
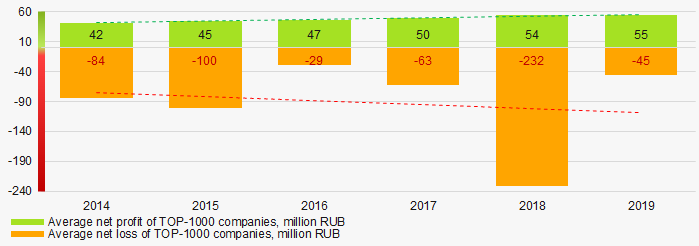 Picture 6. Change in average net profit and net loss of ТОP-1000 companies in 2014 – 2019
Key financial ratios
During six-year period, the average values of the current liquidity ratio of TOP-1000 companies were above the recommended one – from 1,0 to 2,0, with a trend to increase. (Picture 7).
Current liquidity ratio (current assets to short-term liabilities) shows the sufficiency of company’s assets to repay on short-term liabilities.
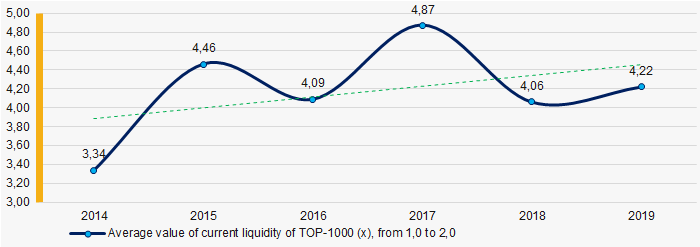 Picture 7. Change in average values of current liquidity ratio of TOP-1000 in 2014 – 2019
During six years, there was a general trend to decrease in the average ROI values (Picture 8).
ROI ratio is calculated as net profit to sum of shareholders equity and long-term liabilities, and shows the return of equity involved in commercial activities and long-term borrowed funds.
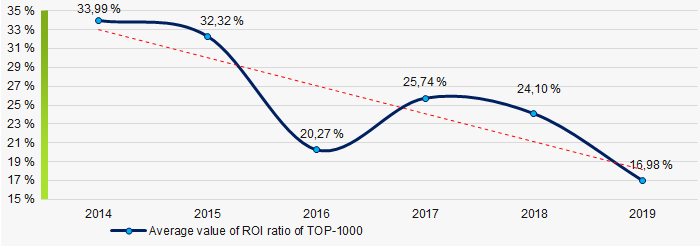 Picture 8. Change in average values of ROI ratio of TOP-1000 in 2006 – 2011
Assets turnover ratio is the ratio of sales revenue and company’s average total assets for a period. It characterizes the effectiveness of using of all available resources, regardless the source of their attraction. The ratio shows how many times per year the full cycle of production and circulation is performed, generating the corresponding effect in the form of profit.
During the six-year period, there was a trend to decrease of this ratio (Picture 9).
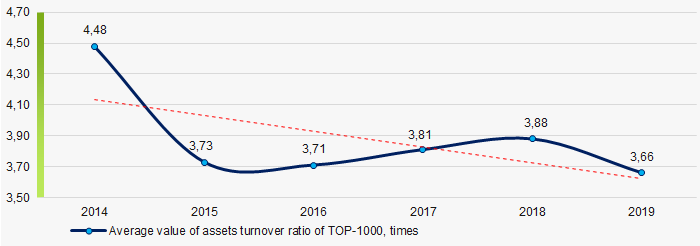 Picture 9. Change in average values of assets turnover ratio of TOP-1000 companies in 2014 – 2019
Small enterprises
77% companies of TOP-1000 are registered in the Register of small and medium-sized enterprises of the Federal Tax Service of the Russian Federation. However, their share in total revenue of TOP-1000 amounted 47%, which is twice lower than the average country values in 2018 - 2019 (Picture 10).
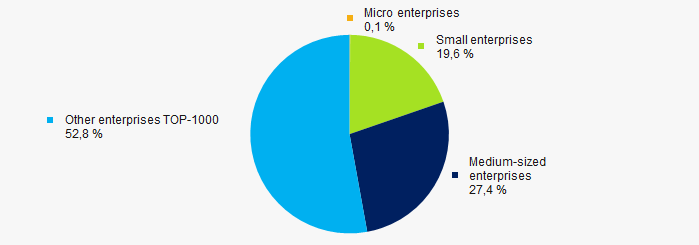 Picture 10. Shares of small and medium-sized enterprises inTOP-1000
Main regions of activity
Companies of TOP-1000 are registered in 78 regions of Russia, and unequally located across the country. More than 26% of companies largest by revenue consolidate in Moscow, Moscow region and Krasnodar territory (Picture 11).
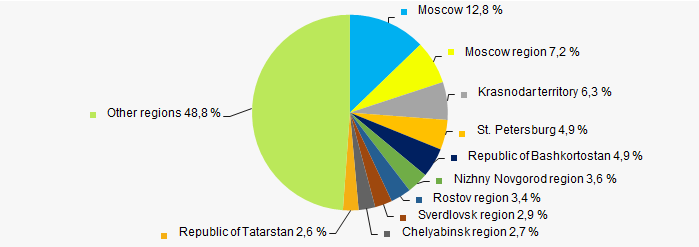 Picture 11. Distribution of TOP-1000 revenue by the regions of Russia
Financial position score
According to the assessment, the financial position of most of TOP-1000 companies is above average (Picture 12).
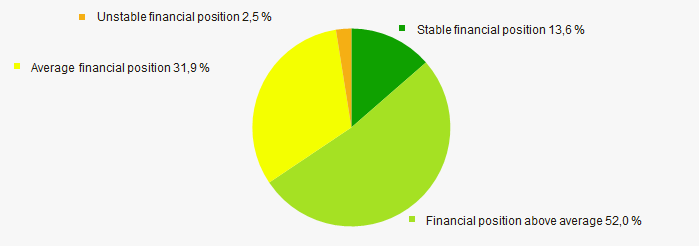 Picture 12. Distribution of TOP-1000 companies by financial position score
Solvency index Globas
Most of TOP-1000 companies got Superior / High and Strong / Medium index Globas. This fact shows their ability to meet their obligations fully and by the due date (Picture 13).
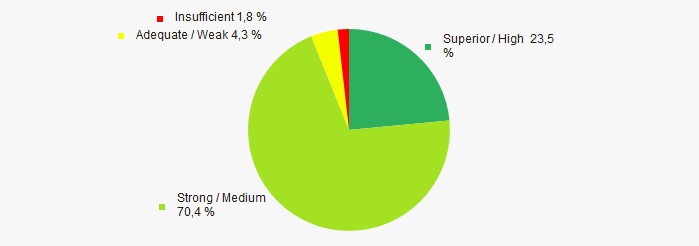 Picture 13. Distribution of TOP-1000 companies by solvency index Globas
Conclusion
Complex assessment of activity of the largest companies with UTII, taking into account the main indexes, financial ratios and indicators, demonstrates the prevalence of positive trends in their activity in 2014- 2019 (Table 1).
| Trends and evaluation factors | Relative share of factors, % |
| Dynamics of the average net assets value | |
| Rate of growth (decline) in the average size of net assets | |
| Increase / decrease in the share of enterprises with negative values of net assets | |
| Level of capital concentration | |
| Dynamics of the average revenue | |
| Rate of growth (decline) in the average size of revenue | |
| Dynamics of the average profit (loss) | |
| Rate of growth (decline) in the average size of profit (loss) | |
| Growth / decline in average values of net profit | |
| Growth / decline in average values of net loss | |
| Increase / decrease in average values of current liquidity ratio | |
| Increase / decrease in average values of return on investment ratio | |
| Increase / decrease in average values of asset turnover ratio, times | |
| Share of small and medium-sized businesses in terms of revenue being more than 22% | |
| Regional concentration | |
| Financial position (the largest share) | |
| Solvency index Globas (the largest share) | |
| Average value of relative share of factors | |
![]() positive trend (factor),
positive trend (factor), ![]() negative trend (factor).
negative trend (factor).