
Order a report
Custom-made industry research, company ratings, competitor analysis


Net profit ratio of the largest Russian coal mining companies
Information agency Credinform represents the ranking of Russian coal mining companies. Coal mining enterprises with the largest volume of annual revenue (TOP-10) were selected for the ranking, according to the data from the Statistical Register for the latest available periods (for 2015 - 2017). Then they were ranked by the revenue volume (Table 1). The analysis was made on the basis of the data of the Information and Analytical system Globas.
Proceeds from the sale of goods, products, works, services – these are monetary amounts or material values in monetary terms, obtained as a result of business activities after the sale of goods and services.
Net profit ratio is a relation of net profit (loss) of a company to sales revenue.
The revenue and ratio show the scale of an enterprise and the effectiveness of its business activities. As a rule, the larger is company's revenue, the higher is its resistance to the effects of negative factors that could be crushing for small and micro enterprises. Revenue also indicates the production capacity of an organization, especially if you look at this indicator in dynamics. By adding to the analysis of the net profit ratio, it is possible to assess realistically the competitiveness of the company in the market. A high value of the net profit ratio (above the industry average) characterizes a more successful position of the enterprise in relation to its competitors.
In 2016, about 30% of coal mining companies had the net profit ratio higher than the industry average one, and in 2017 - only 23.8%. This suggests that, in general, the coal industry is not sufficiently effective in terms of the ability of the majority of companies to compete on an equal footing. To a some extent, this is due to a certain concentration: the TOP-10 companies cover 40% of the entire coal mining industry, and the TOP-25 - already more than 65%.
For getting of the most comprehensive and fair picture of the financial standing of enterprises of this sector it is necessary to pay attention to combination of the two considered indicators and take into account the dynamics of their change. The ranking of TOP-10 companies is presented below (Table 1).
| Name, INN, region | Sales revenue, mln RUB | Net profit (loss), mln RUB | Net profit ratio, in % | Solvency index Globas | |||
| 2016 | 2017 | 2016 | 2017 | 2016 | 2017 | ||
| 1 | 2 | 3 | 4 | 5 | 6 | 7 | 8 |
| NJSC SUEK-KUZBASS INN 4212024138 Kemerovo region |
|
|
|
|
|
|
204 Strong |
| NJSC COAL COMPANY KUZBASSRAZREZUGOL INN 4205049090 Kemerovo region |
|
|
|
|
|
|
218 Strong |
| JSC HC YAKUTUGOL INN 1434026980 Republic of Sakha (Yakutia) |
|
|
|
|
|
|
231 Strong |
| NJSC PREPARATION PLANT RASPADSKAYA INN 4214018690 Kemerovo region |
|
|
|
|
|
|
225 Strong |
| NJSC SIBERIAN ANTHRACITE INN 5406192366 Novosibirsk region |
|
|
|
|
|
|
205 Strong |
| NJSC RAZREZ TUGNUISKY INN 0314002305 Republic of Buryatia |
|
|
|
|
|
|
213 Strong |
| NJSC TSENTRALNAYA OBOGATITELNAYA FABRIKA KUZNETSKAYA INN 4218000253 Kemerovo region |
|
|
|
|
|
|
184 High |
| PJSC UGOLNAYA KOMPANIYA YUZHNY KUZBASS INN 4214000608 Kemerovo region |
|
|
|
|
|
|
233 Strong |
| PJSC KUZBASSKAYA TOPLIVNAYA COMPANY INN 4205003440 Kemerovo region |
|
|
|
|
|
|
171 Superior |
| NJSC MEZHDURECHIE INN 4214000252 Kemerovo region |
|
|
|
|
|
|
197 High |
| Total by TOP-10 companies | |
|
|
|
|||
| Average value by TOP-10 companies | |
|
|
|
|
|
|
| Industry average value | |
|
|
|
|
|
|
![]() — improvement of the indicator to the previous period,
— improvement of the indicator to the previous period, ![]() — decline in the indicator to the previous period.
— decline in the indicator to the previous period.
The average value of the net profit ratio of TOP-10 companies is above the industry average one. In 2017, all TOP-10 companies improved sales revenue, and in terms of the net profit ratio eight companies increased their efficiency. Moreover, all average values of companies’ indicators improved.
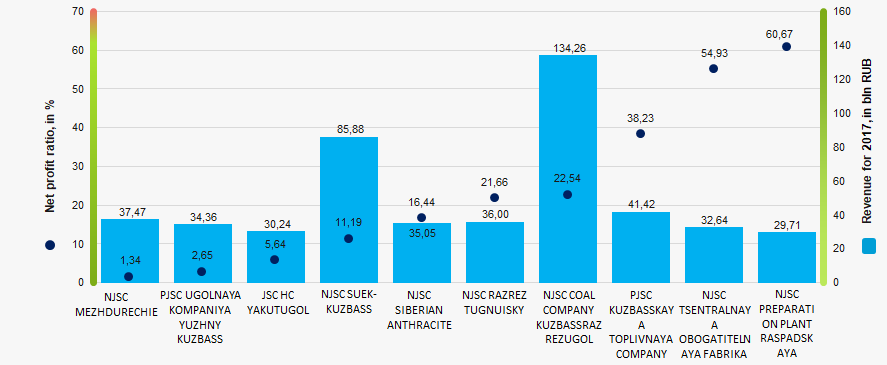 Picture 1. Net profit ratio and revenue of the largest Russian coal mining companies (TOP-10)
67,2% of the total revenue of the industry in 2017 was generated by enterprises located in Kemerovo region (Picture 2). At the same time, only 34% of coal mining companies operate in this region. This indicates that namely Kemerovo region is the locomotive of the coal industry. The second place in terms of revenue takes the Republic of Sakha (Yakutia). It accounts for 5,8% of total consolidated revenue and 3,6% of companies.
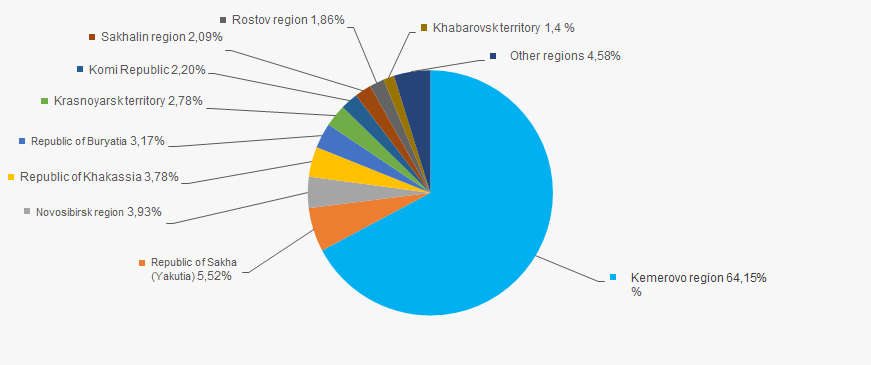 Picture 2. Distribution of regions by share in total revenue in 2017
For 10 years, industry average values of the net profit ratio have a certain stability, except for the crisis years (picture 3). In general, the industry was able to cope with the recession of 2013-2015 and reach the pre-crisis level of the net profit ratio.
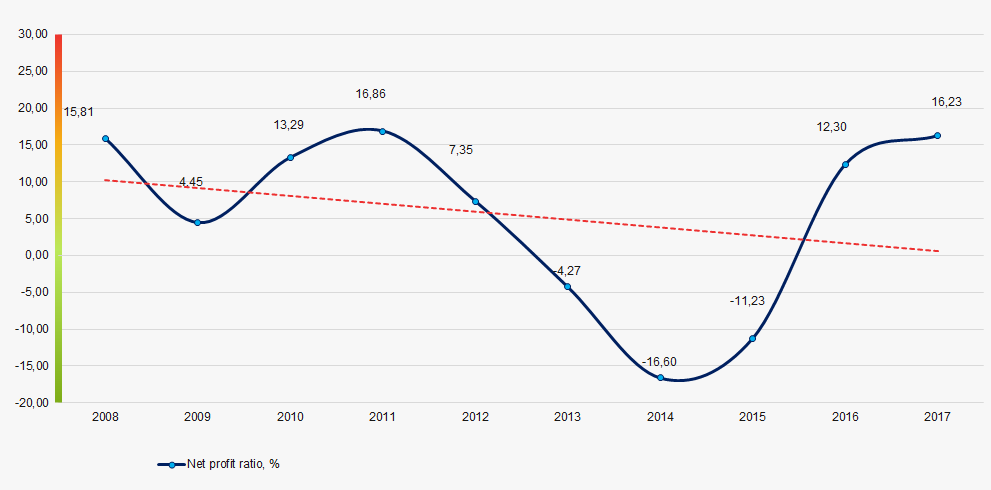 Picture 3. Change in industry average values of the net profit ratio of Russian coal mining companies in 2008–2017