
Order a report
Custom-made industry research, company ratings, competitor analysis


Solvency ratio of the largest Russian manufacturers of packaging
Information agency Credinform has prepared a ranking of the largest Russian manufacturers of packaging. The companies with the largest annual revenue (TOP-10) have been selected for the ranking, according to the data from the Statistical Register for the latest available accounting periods (2016, 2015 and 2014). Then they have been ranked by solvency ratio (Table 1). The analysis was based on the data from the Information and Analytical system Globas.
Solvency ratio (x) is a ratio of shareholders’ equity to total assets, and it shows the dependence of the company on external loans. Its recommended value: > 0,5. A value less than a minimum one is indicative of dependence on external sources of funds, which may result in a liquidity crisis, unstable financial standing in the event of economic downturn.
The whole set of indicators and financial ratios is to be considered in order to get a full and comprehensive insight into a company’s financial standing.
| Name, INN, region | Revenue, million RUB | Net profit, million RUB | Solvency ratio (x), > 0,5 | Solvency index Globas | |||
| 2015 | 2016 | 2015 | 2016 | 2015 | 2016 | ||
| 1 | 2 | 3 | 4 | 5 | 6 | 7 | 8 |
| National Enterprise Naberezhnochelninsky paperboard plant S.P.Titov NJSC INN 1650017638 Republic of Tatarstan |
8 268 | 9 418 | 1 283 | 1 262 | 0,89 | 0,89 | 148 Superior |
| AR Carton NJSC INN 2353017002 Krasnodar territory |
5 579 | 6 199 | 778 | 668 | 0,60 | 0,84 | 130 Superior |
| ALPLA LLC INN 5056000026 Moscow region |
6 695 | 7 679 | 787 | 1 180 | 0,54 | 0,76 | 136 Superior |
| Stora Enso Packaging BB LLC INN 4003014954 Kaluga region |
6 595 | 7 733 | 903 | 1 415 | 0,56 | 0,74 | 148 Superior |
| Smurfit Kappa Saint Petersburg NJSC INN 4703029321 Leningrad region |
5 451 | 6 347 | 250 | 481 | 0,66 | 0,70 | 144 Superior |
| ARKHBUM NJSC INN 2903003430 Arkhangelsk region |
6 169 | 7 650 | 217 | 817 | 0,47 | 0,57 | 176 High |
| Tetra Pak NJSC INN 7706017070 Moscow |
39 018 | 39 663 | 2 643 | 4 744 | 0,26 | 0,43 | 177 High |
| Huhtamaki CIS LLC INN 7724000760 Moscow region |
5 074 | 6 261 | 151 | 591 | 0,23 | 0,35 | 202 Strong |
| RETAL NJSC INN 7704521059 Moscow region |
16 073 | 15 118 | 705 | 657 | 0,30 | 0,26 | 203 Strong |
| GOTEK NJSC INN 4633000037 Kursk region |
5 789 | 6 695 | 159 | 77 | 0,00 | 0,01 | 232 Strong |
| Total for TOP-10 | 104 710 | 112 762 | 7 876 | 11 893 | |||
| Average value for TOP-10 | 10 471 | 11 276 | 788 | 1 189 | 0,45 | 0,56 | |
| Average value for TOP-1000 | 345 | 386 | 14 | 21 | |||
Average value of solvency ratio for TOP-10 companies in 2016 is above the recommended value. Six of TOP-10 companies increased their revenue and net profit in 2015 – 2016 2016 compared to prior period (highlighted green in columns 2 – 5 of Table 1). Other companies had a decrease in revenue or net profit (highlighted red in columns 2 – 5 of Table 1).
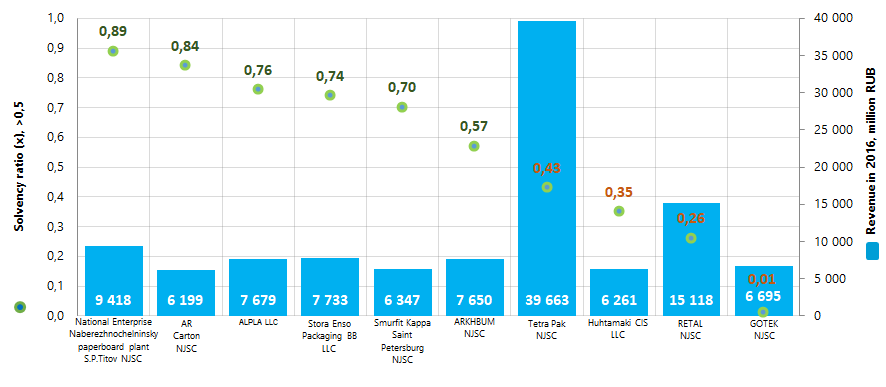 Picture 1. Solvency ratio and revenue of the largest Russian manufacturers of packaging (TOP-10)