
Order a report
Custom-made industry research, company ratings, competitor analysis


Return on sales of the largest Russian manufacturers and suppliers of coffee, tea, cocoa and spices
Information agency Credinform Credinform represents the ranking of the largest Russian manufacturers and suppliers of coffee, tea, cocoa and spices. Enterprises with the largest volume of annual revenue (TOP-10) were selected for the ranking, according to the data from the Statistical Register for the latest available periods (for 2014-2016). Then they were ranked by return on sales ratio (Table 1). The analysis was made on the basis of the data of the Information and Analytical system Globas.
Return on sales (%) is calculated as the share of operating profit in in the total sales of a company. Return on sales ratio reflects the efficiency of industrial and commercial activity of an enterprise and shows the share of company’s funds obtained as a result of sale of products, after covering its cost price, paying taxes and interest payments on loans.
Spread in values of the return on sales in companies of the same industry is determined by differences in competitive strategies and product lines.
The experts of the Information agency Credinform, taking into account the actual situation both in the economy as a whole and in the sectors, has developed and implemented in the Information and Analytical system Globas the calculation of practical values of financial ratios that can be recognized as normal for a particular industry.
For manufacturers and suppliers of coffee, tea, cocoa and spices the averaged practical value of the return on sales ratio made from 8,58% in 2016.
For getting of the most comprehensive and fair picture of the financial standing of an enterprise it is necessary to pay attention to all combination of indicators and financial ratios.
| Name, INN, регион , main type of activity | Revenue, mln RUB | Net profit, mln RUB | Return on sales, % | Solvency index Globas | |||
| 2015 | 2016 | 2015 | 2016 | 2015 | 2016 | ||
| 1 | 2 | 3 | 4 | 5 | 6 | 7 | 8 |
| UNILEVER RUS LLC INN 7705183476 Moscow Tea and coffee manufacture |
|
|
|
|
|
|
260 Medium |
| NESTLE KUBAN LLC INN 2353018969 Krasnodar territory Tea and coffee manufacture |
|
|
|
|
|
|
244 Strong |
| ORIMI LLC INN 4703044256 Leningrad region Tea and coffee manufacture |
|
|
|
|
|
|
180 High |
| STRAUSS LLC INN 7726584503 Vladimir region Wholesale of coffee, tea, cocoa and spices |
|
|
|
|
|
|
231 Strong |
| MAY-FOODS LLC INN 7723138243 Moscow Wholesale of coffee, tea, cocoa and spices |
|
|
|
|
|
|
167 Superior |
| ORIMI TRADE LLC INN 7804069580 Leningrad region Wholesale of coffee, tea, cocoa and spices |
|
|
|
|
|
|
217 Strong |
| CENTRAL DISTRIBUTION COMPANY LLC INN 7726332400 Moscow Wholesale of coffee, tea, cocoa and spices |
|
|
|
|
|
|
202 Strong |
| May-Foods LLC INN 7722860520 Moscow Wholesale of coffee, tea, cocoa and spices |
|
|
|
|
|
|
201 Strong |
| PETERBURGSKAYA PRODOVOLSTVENNAYA KORPORATSIYA LLC INN 7804307179 St.-Petersburg Spices manufacture |
|
|
|
|
|
|
293 Medium |
| FES PRODUKT LLC INN 5007049413 Moscow region Tea and coffee manufacture |
|
|
|
|
|
|
251 Medium |
| Total by TOP-10 companies | |
|
|
|
|||
| Average value by TOP-10 companies | |
|
|
|
|
|
|
![]() — increase in the indicator to the previous period,
— increase in the indicator to the previous period, ![]() — decrease in the indicator to the previous period.
— decrease in the indicator to the previous period.
The average value of the return on sales ratio of TOP-10 enterprises is below the averaged practical value. FES PRODUKT LLC has a negative value of the return on sales ratio in 2015 — 2016.
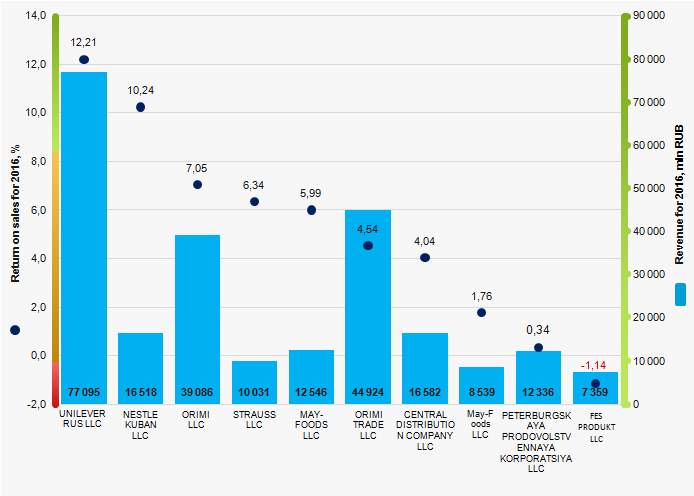 Picture 1. Return on sales ratio and revenue of the largest Russian manufacturers and suppliers of coffee, tea, cocoa and spices (TOP-10)
Within 10 years industry average indicators of the return on sales ratio in the manufacture of spices tend to decline, in the production of tea and coffee, as well as in the wholesale of coffee, tea, cocoa and spices tend to increase (Picture 2).
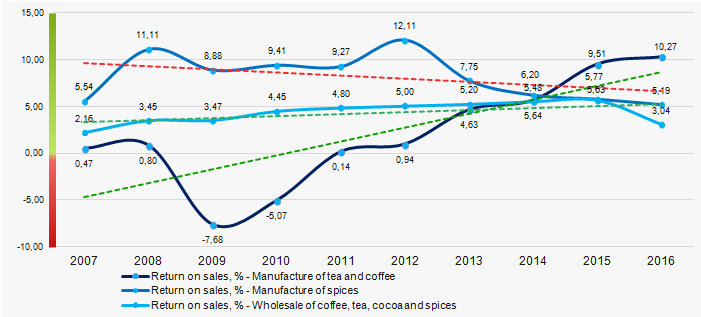 Picture 2. Change in the industry average values of the return on sales ratios of the largest Russian manufacturers and suppliers of coffee, tea, cocoa and spices in 2007 — 2016