
Order a report
Custom-made industry research, company ratings, competitor analysis


Trends in the activity of Dagestani companies
Information agency Credinform represents an overview of activity trends of the largest companies in the real sector of the economy of the Republic of Dagestan.
The enterprises with the largest volume of annual revenue in the real sector of the economy of the Republic of Dagestan (TOP-10 and TOP-1000) were selected for the analysis, according to the data from the Statistical Register for the latest available periods (for 2012 - 2017). The analysis was made on the basis of the data of the Information and Analytical system Globas.
Net assets are an indicator, reflecting the real value of company’s property, is calculated annually as the difference between assets on the enterprise balance and its debt obligations. The indicator of net assets is considered negative (insufficiency of property), if company’s debt exceeds the value of its property.
| № | Name, INN, type of activity |
Net assets value, bln RUB |
Solvency index Globas | ||||
| 2013 | 2014 | 2015 | 2016 | 2017 | |||
| 1 | 2 | 3 | 4 | 5 | 6 | 7 | 8 |
| 1 | KIZLYARSKII KONYACHNYI ZAVOD PJSC INN 0547011052 Production of distilled drinking alcoholic beverages: vodka, whiskey, brandy, gin, liqueurs, etc. |
|
|
|
|
|
231 Strong |
| 2 | GAZPOM TRANSGAZ MAKHACHKALA LLC INN 0500000136 Transportation of gas and products of its processing through pipelines |
|
|
|
|
н/д | 208 Strong |
| 3 | DERBENT COGNAC PLANT NJSC INN 0542003065 Production of food alcohol |
|
|
|
|
|
218 Strong |
| 4 | MAKHACHKALINSKII MORSKOI TORGOVYI PORT NJSC INN 0573008521 Cargo handling |
|
|
|
|
|
268 Medium |
| 5 | DAGNEFTEGAS NJSC INN 0515012247 Extraction of natural gas and gas condensate |
|
|
|
|
|
289 Medium |
| 996 | MAKHACHKALAVODOKANAL PJSC INN 0560037035 Distribution of water for drinking and industrial needs |
|
|
|
|
|
317 Adequate |
| 997 | GAZPROM GAZORASPREDELENIE DAGESTAN INN 0561049072 Transportation of gas through pipelines |
|
|
|
|
|
340 Adequate |
| 998 | DAGESTANSKAYA SETEVAYA KOMPANIYA NJSC INN 2632800485 Transmission of electricity and technological connection to distribution networks |
|
|
|
|
|
350 Adequate |
| 999 | CASPIAN FLAT GLASS NJSC INN 0522016027 Production of flat glass Case on declaring the company bankrupt (insolvent) is proceeding |
|
|
|
|
|
550 Insufficient |
| 1000 | DAGESTANSKAYA ENERGOSBYTOVAYA KOMPANIYA PJSC INN 0541031172 Sale of electric power |
|
|
|
|
|
309 Adequate |
![]() — increase in the indicator to the previous period,
— increase in the indicator to the previous period, ![]() — decrease in the indicator to the previous period.
— decrease in the indicator to the previous period.
The average values of net assets of TOP-1000 enterprises tend to decrease over the five-year period (Picture 1).
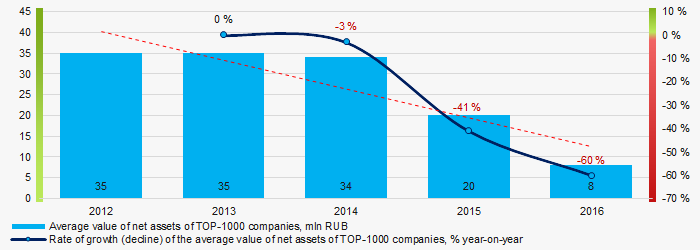 Picture 1. Change in average indicators of the net asset value of TOP-1000 companies in 2012 – 2016
The share of enterprises with insufficiency of assets tend to grow over the five-year period (Picture 2).
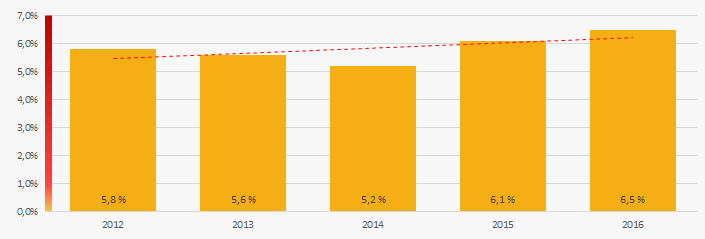 Picture 2. Share of enterprises with negative values of net assets in TOP-1000
Sales revenue
The revenue volume of 10 industry leaders made 41% of the total revenue of TOP-1000 companies in 2016. (Picture 3). It points to a relatively high level of capital concentration in the Republic of Dagestan.
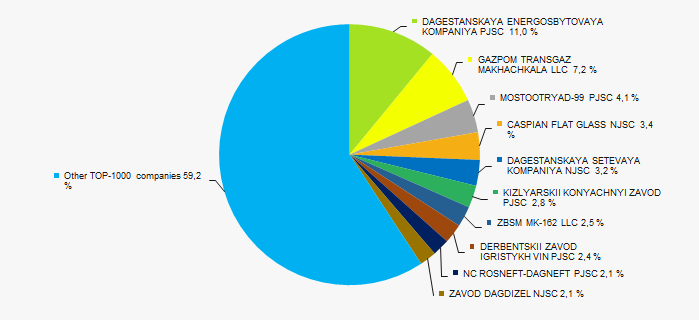 Picture 3. Shares of participation of TOP-10 companies in the total revenue of TOP-1000 enterprises for 2016
In general, there is a trend towards an increase in revenue volume (Picture 4).
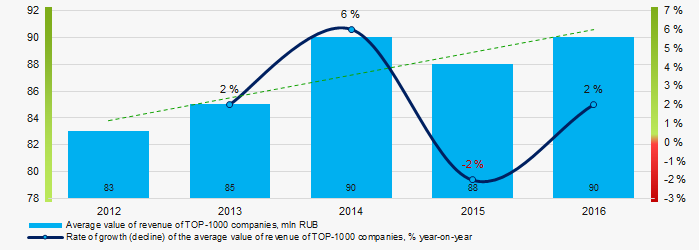 Picture 4. Change in the average revenue of TOP-1000 companies in 2012 – 2016 годах
Profit and losses
The profit volume of 10 industry leaders made 54% of the total profit of TOP-1000 companies in 2016 (Picture 5).
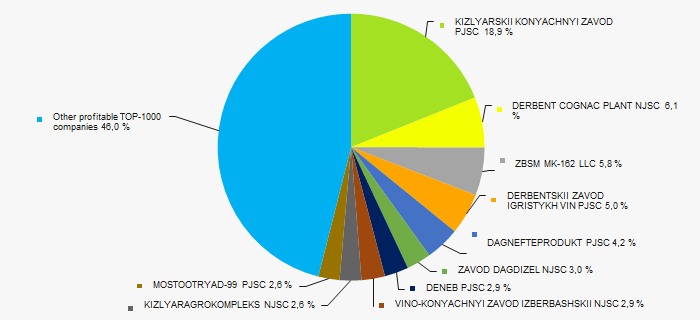 Picture 5. Shares of participation of TOP-10 companies in the total volume of profit of TOP-1000
Average values of net profit’s indicators of TOP-1000 companies do not to increase over the five-year, while the average size of net loss increases (Picture 6).
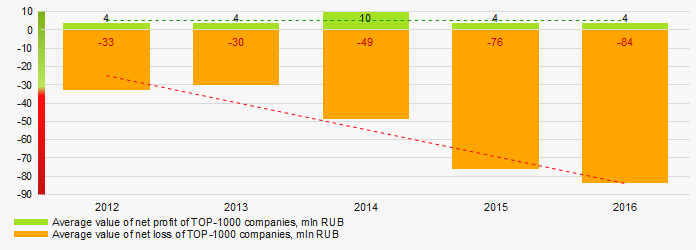 Picture 6. Change in the average values of indicators of profit and loss of TOP-1000 companies in 2012 – 2016
Key financial ratios
Over the five-year period the industry average indicators of the total liquidity ratio were much higher than the interval of recommended values - from 1.0 up to 2.0, with a tendency to increase (Picture 7).
The total liquidity ratio (the relation of the amount of current assets to short-term liabilities) shows the sufficiency of company’s funds for repayment of its short-term liabilities.
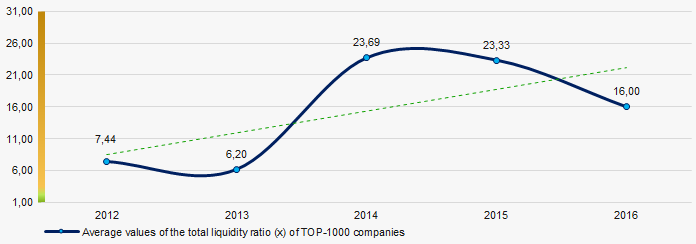 Picture 7. Change in average values of the total liquidity ratio of TOP-1000 companies in 2012 – 2016
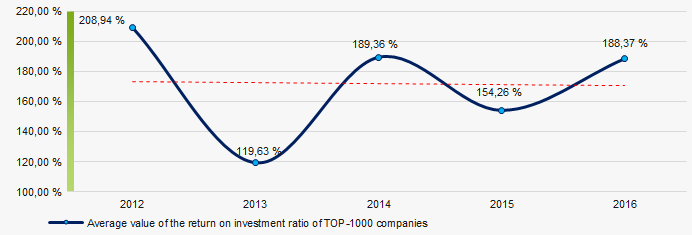
There is a high level of average values of the return on investment ratio within five years, with a tendency to some decrease return on investment ratio within five years, with a tendency to some decrease (Picture 8).
The ratio is calculated as the relation of net profit to the sum of own capital and long-term liabilities and demonstrates the return on the equity involved in the commercial activity of own capital and the long-term borrowed funds of an organization.
 Picture 8. Change in average values of the return on investment ratio of TOP-1000 companies in 2012 – 2016
Asset turnover ratio is calculated as the relation of sales proceeds to the average value of total assets for a period and characterizes the efficiency of use of all available resources, regardless of the sources of their attraction. The ratio shows how many times a year a complete cycle of production and circulation is made, yielding profit.
This ratio of business activity showed a tendency to decrease over the five-year period (Picture 9).
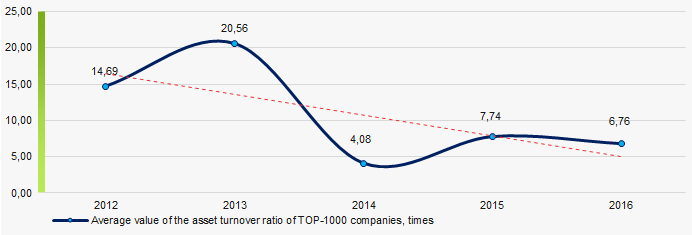 Picture 9. Change in average values of the asset turnover ratio of TOP-1000 companies in 2012 – 2016
Production structure
The largest share in the total revenue of TOP-1000 is owned by companies, specializing in provision of electric power, gas and steam, as well as wholesale (Picture 10).
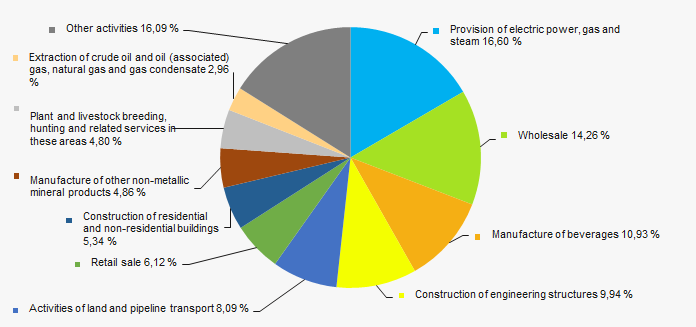 Picture 10. Distribution of types of activity in the total revenue of TOP-1000 companies
48% of TOP-1000 companies are registered in the Register of small and medium-sized businesses of the Federal Tax Service of the RF (Picture 11).
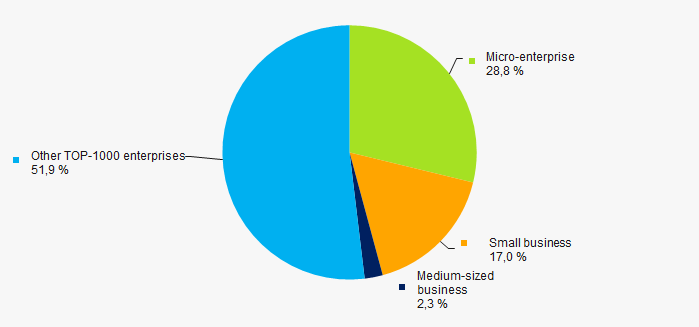 Picture 11. Shares of small and medium-sized businesses in TOP-1000 companies
Financial position score
An assessment of the financial position of TOP-1000 companies shows that their the largest number are in the average financial position (Picture 12).
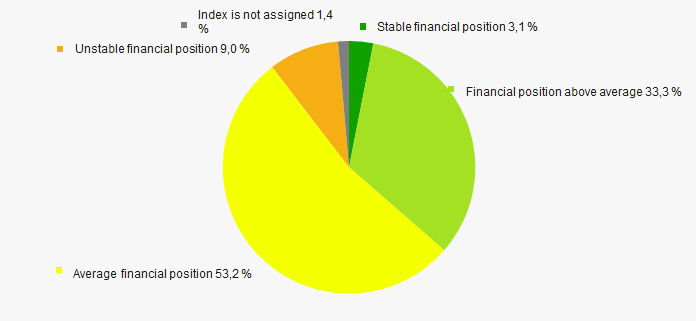 Picture 12. Distribution of TOP-1000 companies by financial position score
Solvency index Globas
Most of TOP-1000 companies got Strong or Medium Solvency index Globas, that points to their ability to pay off their debts in time and fully (Picture 13).
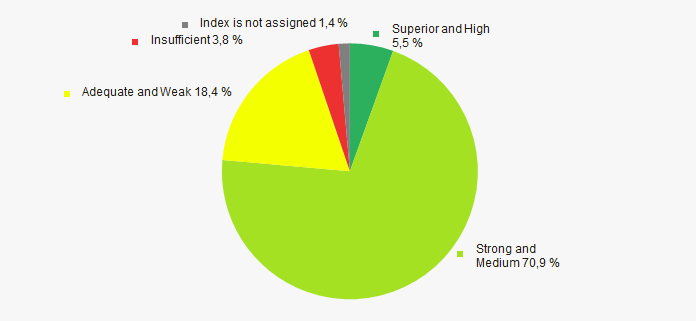 Picture 13. Distribution of TOP-1000 companies by solvency index Globas
 Conclusion
A comprehensive assessment of activity of the largest companies in the real sector of the economy of the Republic of Dagestan, taking into account the main indices, financial indicators and ratios, points to favorable trends, such as revenue growth, a high level of total liquidity and return on investment ratios. However, alarming and negative factors are: decrease in the average size of net assets and an increase in the share of companies with insufficiency of property, growing net losses, trends in the decline in the return on investment and asset turnover ratios
According to the Federal Service of State Statistics, there is a tendency to increase the industrial production index in the Republic of Dagestan in 2017 – 2018, higher than Russia average. Thus, for 8 months of 2018 the industrial production index increased on average by 7,5%, and in general for the period 2017 - 2018 - by 3% (Picture 14).
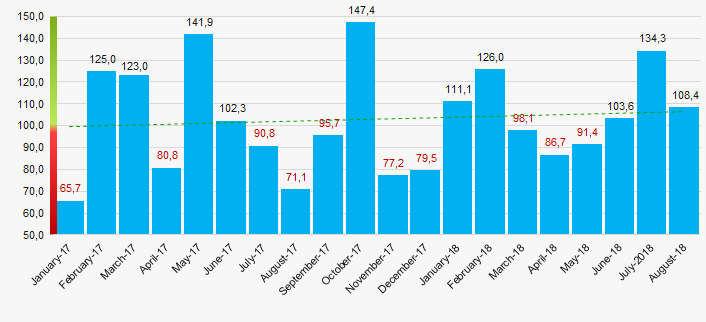 Picture 14. Industrial production index in the Republic of Dagestan in 2017 – 2018, month-over-month (%)
According to the same information, the share of the Republic of Dagestan in the amount of proceeds from the sale of goods, products, works, services countrywide made 0,06% for 8 months of 2018.