
Order a report
Custom-made industry research, company ratings, competitor analysis


Equity turnover of IT-companies
Information agency Credinform represents the ranking of the largest Russian IT-companies. The enterprises with the largest volume of annual revenue (TOP-10) were selected for the ranking, according to the data from the Statistical Register for the latest available periods (for 2016 - 2018). Then they were ranked by the equity turnover ratio (Table 1). The analysis was made on the basis of the data of the Information and Analytical system Globas.
Equity turnover ratio (times) is defined as a relation of revenue to annual average sum of equity and shows the company’s usage rate of all available assets.
Equity turnover ratio reflects the turnover rate of own capital. The high value of this ratio indicates the effectiveness of use of own funds. Accordingly, the low ratio value indicates about inaction of the part of own funds.
The experts of the Information agency Credinform, taking into account the actual situation both in the economy as a whole and in the sectors, has developed and implemented in the Information and Analytical system Globas the calculation of practical values of financial ratios that can be recognized as normal for a particular industry. For IT-companies the practical value of the equity turnover ratio made from 1,96 times in 2018.
For getting of the most comprehensive and fair picture of the financial standing of an enterprise it is necessary to pay attention to all combination of indicators and financial ratios.
| Name, INN, region | Revenue, million RUB | Net profit (loss), million RUB | Equity turnover, times | Solvency index Globas | |||
| 2017 | 2018 | 2017 | 2018 | 2017 | 2018 | ||
| 1 | 2 | 3 | 4 | 5 | 6 | 7 | 8 |
| CENTRE OF LOYALTY PROGRAMMES NJSC INN 7702770003 Moscow |
|
|
|
|
|
|
211 Strong |
| SIBERIAN INTERNET COMPANY LLC INN 7708119944 Moscow |
|
|
|
|
|
|
194 High |
| VISA PAYMENT SYSTEM LLC INN 7710759236 Moscow |
|
|
|
|
|
|
251 Medium |
| GAZPROM INFORM LLC INN 7727696104 Moscow |
|
|
|
|
|
|
220 Strong |
| INLINE TELECOM SOLUTIONS LLC INN 7715612935 Moscow |
|
|
|
|
|
|
235 Strong |
| NETCRACKER LLC INN 7713511177 Moscow |
|
|
|
|
|
|
159 Superior |
| RN-CARD LLC INN 7743529527 Moscow |
|
|
|
|
|
|
220 Strong |
| LUKOIL-INFORM LLC INN 7705514400 Moscow |
|
|
|
|
|
|
223 Strong |
| MASTERCARD LLC INN 7707724547 Moscow |
|
|
|
|
|
|
190 High |
| MAIL.RU LLC INN 7743001840 Moscow |
|
|
|
|
|
|
190 High |
| Average value by TOP-10 companies | |
|
|
|
|
|
|
| Industry average value | |
|
|
|
|
|
|
![]() improvement of the indicator to the previous period,
improvement of the indicator to the previous period, ![]() decline in the indicator to the previous period
decline in the indicator to the previous period
The average value of equity turnover ratio of TOP-10 enterprises is above industry average and practical values. Three companies improved the result in 2018.
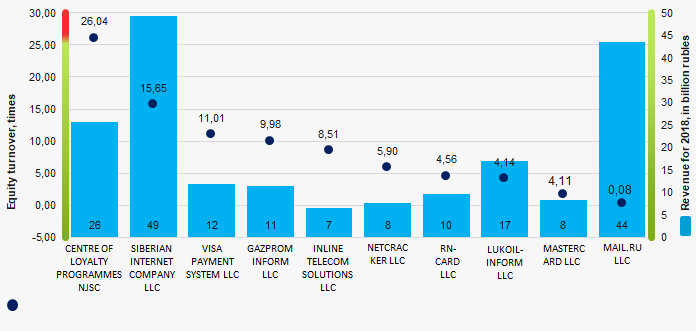 Picture 1. Equity turnover ratio and revenue of the largest Russian IT-companies (TOP-10)
The industry average indicators of equity turnover ratio have a downward trend over the course of five years. (Picture 2).
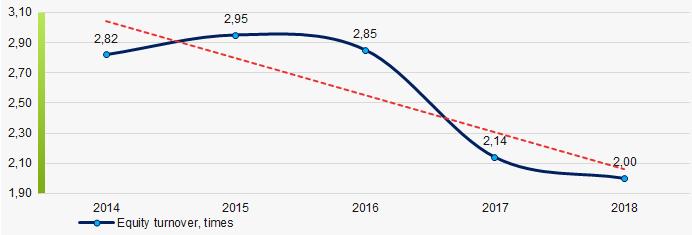 Picture 2. Change in the industry average values of equity turnover ratio of Russian IT-companies in 2014 – 2018