
Order a report
Custom-made industry research, company ratings, competitor analysis


Key trends in the russian foreign trade
Following the results of 2018, the volume of foreign trade turnover of Russia amounted to 693 billion dollars, while export and import reached 444 and 249 billion dollar respectively. Russia is the third in the world by positive balance of trade after China and Germany.
Trend #1. Dynamics: export is growing faster than import
Having faced the crisis in 2016, the Russian export in 2017-2018 increases by 25% annually, but still has not exceeded the maximum figure of 527 billion dollars recorded in 2012. If the existing growing trend continues, the export will be expected to reach 555 billion dollars at the end of 2019.
Less has been achieved in import: due to the low demand, it increased only by 4,6% in the previous year (see Picture 1).
The increase in currency earnings from foreign trade and positive balance of trade show export competitiveness, availability of import-substituting products and capacity of budget replenishment.
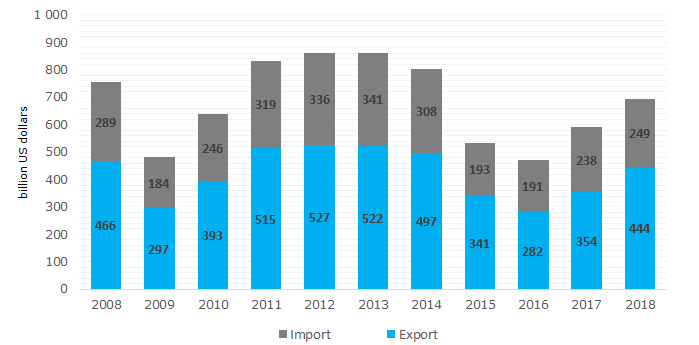 Picture 1. Dynamics of the Russian export, billion US dollars
Trend #2. Goods: the share of non-primary products in exports grows
Fuel and commodities account for 63,8% of Russia’s exports in 2018. As a comparison: in pre-crisis 2013 the share of oil and gas exceeded 70% in total exports. The reduction is slight, but indicative of a gradual change in the commodity groups of the Russian products supplied to the international market and decrease in the share of raw commodities.
Import consists mainly of the second-generation articles - mechanical equipment, electrical machinery, land transport, pharmaceuticals (see Table 1).
The higher is the share of non-primary exports, the more obvious is the recognition of domestic goods quality on the international market, the less is dependence on fluctuations in global commodity prices and the more stable is the economy.
| EXPORT | IMPORT | ||||||
| Rank | Commodity group | Volume, billion US dollars | Share in total volume, % | Rank | Commodity group | Volume, billion US dollars | Share in total volume, % |
| 1 | Mineral fuel | 286,7 | 63,8 | 1 | Mechanical equipment | 43,6 | 18,3 |
| 2 | Ferrous metals | 23,4 | 5,2 | 2 | Electrical machinery and equipment | 29,9 | 12,6 |
| 3 | Armament | 10,5 | 2,3 | 3 | Land transport, except rail | 23,7 | 10,0 |
| 4 | Cereals | 10,5 | 2,3 | 4 | Pharmaceuticals | 10,6 | 4,4 |
| 5 | Jewelry, precious metals | 10,1 | 2,2 | 5 | Plastics and articles thereof | 9,8 | 4,1 |
| 6 | Mechanical equipment, nuclear-power reactors | 9,2 | 2,0 | 6 | Optical tools and apparatus | 6,7 | 2,8 |
| 7 | Wood and articles thereof | 9,0 | 2,0 | 7 | Armament | 6,6 | 2,8 |
| 8 | Fertilizers | 8,2 | 1,8 | 8 | Articles of ferrous metals | 5,8 | 2,4 |
| 9 | Aluminum and articles thereof | 6,6 | 1,5 | 9 | Ferrous metals | 5,3 | 2,2 |
| 10 | Copper and articles thereof | 5,4 | 1,2 | 10 | Edible fruits and nuts | 5,1 | 2,1 |
| Other articles | 69,9 | 15,6 | Other articles | 91,1 | 38,2 | ||
Trend #3. Partners and countries: foreign trade relations remain stable
The European Union remains Russia’s key trade partners both by export (46,1% of total volume) and import (35,8% of total volume), followed by China and the Eurasian Economic Union (see Table 2). Speaking about the rating out of economic unions, the undisputed leader is P.R. China: for the first time ever, the amount of mutual trade exceeded 100 billion dollars.
Sanctions and pressure on Russia's foreign trade partners did not have an impact: reliable mutually beneficial partnership wins a confrontation with the political situation.
| EXPORT | IMPORT | ||||||
| Rank | Country, economic union | Volume, billion US dollars | Share in total volume, % | Rank | Country, economic union | Volume, billion US dollars | Share in total volume, % |
| 1 | EU | 204,9 | 46,1 | 1 | EU | 89,3 | 35,8 |
| 2 | CHINA | 56,0 | 12,6 | 2 | CHINA | 52,2 | 21,0 |
| 3 | EAEU | 37,7 | 8,5 | 3 | EAEU | 18,4 | 7,4 |
| 4 | TURKEY | 21,3 | 4,8 | 4 | USA | 12,5 | 5,0 |
| 5 | SOUTH KOREA | 17,8 | 4,0 | 5 | JAPAN | 8,8 | 3,5 |
| 6 | USA | 12,5 | 2,8 | 6 | SOUTH KOREA | 7,0 | 2,8 |
| 7 | JAPAN | 12,5 | 2,8 | 7 | UKRAINE | 5,5 | 2,2 |
| 8 | UKRAINE | 9,5 | 2,1 | 8 | TURKEY | 4,2 | 1,7 |
| 9 | INDIA | 7,8 | 1,8 | 9 | VIETNAM | 3,6 | 1,4 |
| 10 | EGYPT | 7,1 | 1,6 | 10 | INDIA | 3,2 | 1,3 |
| Top-10 | 387,1 | 87,2 | Top-10 | 204,7 | 82,2 | ||
| TOTAL | 444,0 | 100,0 | TOTAL | 249,1 | 100,0 | ||
Trend #4. Settlement currency: dollar declines
Russia and the EU settle mainly in US currency instead Euro. A central reason is that the Russia’s main exports are hydrocarbons, which are traded for US dollars on the global market. Dollar continues to be the world's main reserve currency. Consequently, it is impossible for the Central Bank of Russia to abandon the dollar, including for foreign economic trade. However, there is a gradual reduction of the dollar’s share when settling (see Picture 2).
The decline of dollar in international settlements was recorded in other countries. Strengthening the position of national currencies, minimizing transaction costs, reducing economic dependence on reserve currencies - these and other advantages will help to keep the trend, including in Russia.
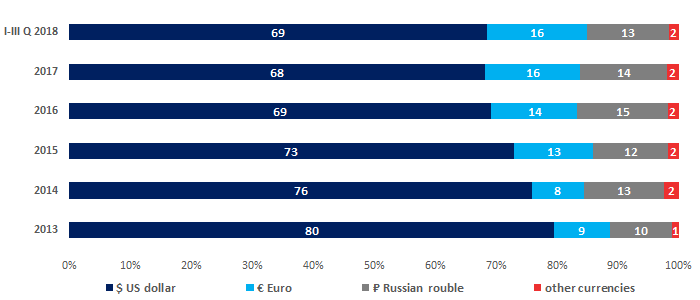 Picture 2. Currency structure of settlements for delivery of goods and services by foreign trade contracts (as percentage of total), currency supply %
Results and forecasts
Having met the crisis decline in 2016, the Russian foreign trade is growing. Intense exports of the Russian companies support industrial growth in fuel and energy sector, ferrous and nonferrous metallurgy, chemical and petrochemical, woodworking and pulp and paper industries, nuclear energy, and military industrial complex. Recently, development of the external turnover is characterized with a growth trend, affected by favorable global market conditions for the key articles of the Russian export, as well as successful geopolitical promotion of the Russian products abroad. All these contribute to the steady flow of foreign exchange earnings into the budget and development of domestic business.
Positive trends in the development of the Russian foreign trade give cause for cautious optimism. However, any predictions should be made with regard to persisting economic and political risks, as well as expectations of a slowdown in global trade.