According to the Federal Tax Service of the Russian Federation (FTS of Russia), there are 3,3 million active legal entities in Russia as of 01.10.2021.
Here are the facts, showing the general portrait of the Russian companies: business in Russia continues to be closed, non-public legal forms lie at the core of it; every tenth company is engaged in commodity production and one third of them meet the requirements of Strong/Medium Solvency index Globas.
General structure
There are almost 2,7 million (82%) profit-making enterprises among active legal entities.
Limited liability company (74%) is the most popular legal form. Joint-stock companies are far less popular – only 1,5%. The share of non-profit enterprises amounts to 14%.
Individuals are represented as owners (shareholders, founders) in 89% of companies. Among them: 6% - companies with participation of foreign resident and 1,2% - foreign residents with 100% capital. Legal entities are represented as shareholders in 15% of companies, including the foreign ones – 0,9%, and with 100% foreign capital – 0,4%.
Individuals manage 99,5% of companies, 2,4% of them have foreign CEOs. Legal entities manage 0,5% of companies, share of foreign managers among them is negligibly small 0,002%.
0,9% of companies have subsidiaries, only 0,01% of them are located abroad. 1,4% companies have separate subdivisions.
Regions of registration
Moscow stays a leader by the number of the legal entities. The share of Moscow and Saint Petersburg amounts to 26%, and almost 48% of active enterprises are registered in 10 largest regions of Russia (Picture 1).
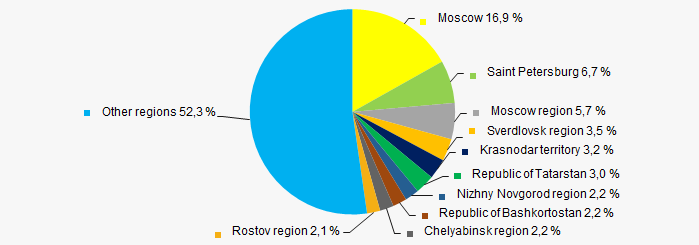
Activity
The largest number of companies is engaged in wholesale (17%) and retail (6%) trade. There are 11% of construction companies, and almost 10% of companies work in real estate business. 5% of companies work in commodity production and 3% - in agriculture (Picture 2).
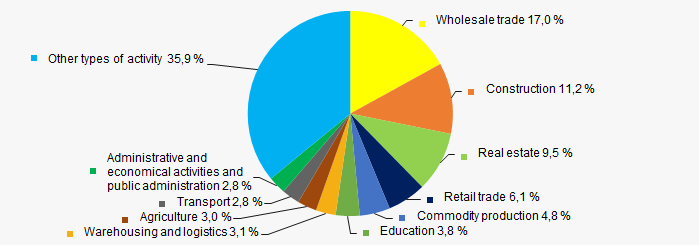
3% of companies are the trademark owners. 20% perform activities having compulsory licenses and 6% - are the members of self-regulatory organizations.
Financial results
Authorized capital of the three quarters of companies doesn’t exceed RUB 100 hundred and of 1,5% - is more than RUB 1 billion.
Annual revenue of 65% companies, having reported to the FTS of Russia on its financial results for 2020, amounts to less than RUB 10 million and of 1% - to more than RUB 1 billion. Annual profit of 29% of companies amounts to more than RUB 1 million, of 0,1% - to more than RUB 1 billion.
Small business
As of 10.10.2021 there are almost 2,3 million legal entities (70% of the total number of the active companies) registered in the Register of Small and Medium-sized Enterprises of the FTS of Russia. The majority of them (91%) are micro enterprises, where more than 5,2 million employees work. Most of small business companies are engaged in construction.
Index Globas
According to the Information and Analytical system Globas, the financial position of 3% of companies is stable, of 8% - is critical. The major part of companies (38%) have an average one. Adequate / Weak Solvency index is given to 49% of companies (Picture 3).
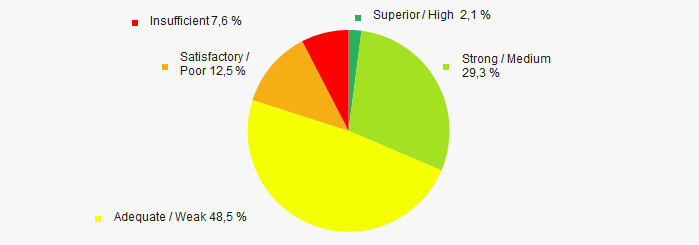
Pipeline transport is one of the cheapest ways of oil and gas transportation to the places of its consumption. It became more important now when Nord Stream 2 pipeline construction was completed. However, analysis of the activity trends of the TOP 100 Russian companies in the industry from 2011 to 2020 shows some negative trends.
The most important of them are high level of monopolization, increase in shares of the companies with insufficient property, decline in profit and growth in loss, decline in financial ratios values. Among positive trends there is growth in the size of net assets and increase in the size of revenue.
For this analysis information agency Credinform selected the largest companies performing gases, fluids, water, cement grout and also other kinds of freights transportation via pipelines (TOP 100) in terms of annual revenue according to the data from the Statistical Register and the Federal Tax Service for the latest available periods (2011-2020). The analysis was based on the data of the Information and Analytical system Globas.
Net assets are total assets less total liabilities. This indicator reflects the real value of the property of an enterprise. When the company’s debt exceeds the value of its property, the indicator is considered negative (insufficiency of property).
The largest company in term of net assets is LLC TRANSNEFT-VOSTOK, INN 3801079671, Irkutsk Region, oil transportation via pipelines. In 2020 net assets of the company exceeded 453 billion RUB.
The lowest net assets value among TOP 100 belonged to GAZPROM GAZORASPREDELENIE DAGESTAN, INN 0561049072, Republic of Dagestan, gas transportation via pipeline. Insufficient property figured out negative value -6 billion RUB.
For the ten-year period the average net assets values and rates of its growth tend to increase. (Picture 1).

Shares of the companies with insufficient property had a negative trend to increase. (Picture 2).

Sales revenue
In 2020, the revenue volume of the ten largest companies was about 71% of total TOP 100 revenue (Picture 3). This indicates a high level of monopolization in the industry.

For ten years industry average revenue values and rates of its growth increase with every year. (Picture 4).

Profit and loss
In 2020, the largest organization in term of profit was OIL TRANSPORTING JOINT-STOCK COMPANY TRANSNEFT, INN 7706061801, Moscow, oil and oil products transportation via pipeline. The company’s profit exceeded 65 billion RUB.
For the ten-year period there is a trend to decrease in the industry average net profit with increasing growth rate (Picture 5).

For the five-year period average net profit of TOP 100 have a decreasing trend with increasing net loss (Picture 6).

Key financial ratios
For the ten-year period industry average values of current liquidity ratio were mostly in the range of the recommended one - from 1,0 to 2,0 with a trend to decrease. (Picture 7).
Current liquidity ratio (current assets to short-term liabilities) shows the sufficiency of company’s assets to repay on short-term liabilities.

For the ten-year period industry average values of ROI ratio were decreasing. (Picture 8).
ROI ratio is calculated as net profit to sum of shareholders equity and long-term liabilities, and shows the return of equity involved in commercial activities and long-term borrowed funds.

Assets turnover ratio is the ratio of sales revenue and company’s average total assets for a period. It characterizes the effectiveness of using of all available resources, regardless the source of their attraction. The ratio shows how many times per year the full cycle of production and circulation is performed, generating the corresponding effect in the form of profit.
For the ten-year period industry average values of assets turnover ratio had a trend to decrease. (Picture 9).

Small business
49% of the TOP 100 companies are registered in the Register of small and medium-sized enterprises of the Federal Tax Service of the Russian Federation. Moreover their share in total revenue of the TOP 100 in 2020 is only 0,2% that is way below the average values over the country in 2018 - 2019. (Рисунок 10).

Main regions of activity
Companies of TOP-100 are registered in 39 regions of Russia, and unequally located across the country due to the specifics of their activity. Almost 84% of total revenue of TOP 100 companies in 2020 are located in ten regions (Picture 11).

Financial position score
Assessment of the financial position of TOP-1000 companies shows that the majority of them have average financial position (Picture 12).

Solvency index Globas
Most of TOP 1000 companies got Superior / High indexes Globas. This fact shows their ability to meet their obligations on time and in full (Picture 13).

Conclusion
Complex assessment of activity of the largest pipeline transport companies demonstrates the prevalence of negative trends in 2011 - 2020 (Table 1).
Trends and evaluation factors | Relative share of factors, % |
Dynamics of the average net assets value | ![]() |
Rate of growth (decline) in the average size of net assets | ![]() |
Increase / decrease in the share of enterprises with negative values of net assets | ![]() |
Level of competition / monopolization | ![]() |
Dynamics of the average revenue | ![]() |
Rate of growth (decrease) in the average size of revenue | ![]() |
Dynamics of the average profit (loss) | ![]() |
Rate of growth (decrease) in the average profit (loss) | ![]() |
Growth / decline in average values of companies’ net profit | ![]() |
Growth / decline in average values of companies’ net loss | ![]() |
Increase / decrease in average values of total liquidity ratio | ![]() |
Increase / decrease in average values of return on investment ratio | ![]() |
Increase / decrease in average values of asset turnover ratio, times | ![]() |
Share of small and medium-sized businesses in terms of revenue being more than 20% | ![]() |
Regional concentration | ![]() |
Financial position (the largest share) | ![]() |
Solvency index Globas (the largest share) | ![]() |
Average value of relative share of factors | ![]() |
positive trend (factor),
negative trend (factor)