Net profit of enterprises engaged in secondary processing of raw materials
Information agency Credinform prepared а ranking of enterprises engaged in secondary processing of raw materials. The ranking list includes industry’s largest companies and is based on turnover as stated in the Statistics register, with the reference period of 2012. The first 10 companies, selected by turnover, later were ranked by net profit value.
Net profit – is a part of company’s gross revenue, which remains at its disposal after payment of taxes, fees, assignments and other obligatory payments to the budget. The company independently defines the directions of net profit use. The part of its profit, intended for distribution between its participants, is allocated in proportion to their shares in the company’s authorized capital. Another part is used for increasing of current assets, creation of funds and reserves, and also for reinvestments in production.
| № | Legal form Name INN | Region | Net profit 2012, mln. RUB. | Turnover 2012, mln. RUB. | Solvency index GLOBAS-i® |
|---|---|---|---|---|---|
| 1 | LLC Vtorresurs - Pererabotka INN 4217126359 | Kemerovo region | 487 | 16 441 | 248 (high) |
| 2 | LLC Uralmetkom-Oskol INN 5607021177 | Belgorod region | 416 | 8 703 | 220 (high) |
| 3 | JSC Pskovvtormet INN 6027007501 | Pskov region | 55 | 8 210 | 214 (high) |
| 4 | LLC Lomprom Don INN 6144012880 | Rostov region | 48 | 8 156 | 231 (high) |
| 5 | LLC Commerce and Industry Company of Yekaterinburg INN 6670025354 | Sverdlovsk region | 32 | 17 854 | 288 (high) |
| 6 | LLC NOVOROSMETALL INN 2315057727 | Krasnodar region | 29 | 10 337 | 222 (high) |
| 7 | LLC Mechel-Vtormet INN 7714844919 | Chelyabinsk region | 28 | 8 548 | 252 (high) |
| 8 | Limited Liability Company Metallolomnaya OMC-EkoMetall INN 7705937571 | Moscow | 9 | 13 506 | 302 (satisfactory) |
| 9 | LLC Severstal Vtorchermet INN 3528165743 | Vologda region | -453 | 25 730 | 332 (satisfactory) |
| 10 | LLC NLMK Vtorchermet INN 7705741770 | Sverdlovsk region | -554 | 31 964 | 304 (satisfactory) |
In terms of industry sector, the largest 2012 turnover demonstrated the companies engaged in recycling of scrap metal.
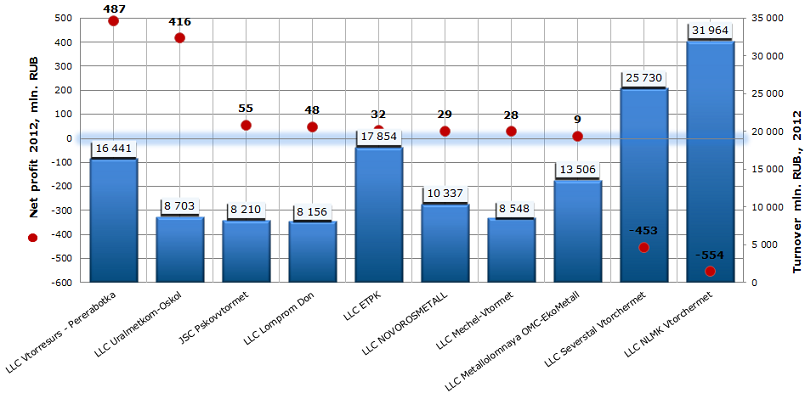
The first place of ranking list takes LLC Vtorresurs - Pererabotka. According to 2012 results the net profit of the company amounted 487 mln. RUB. or 3% of revenue. That testifies about capital intensity of the industry. Besides the company is the fourth in industry by turnover. Such result of company’s financial activity can testify about rational use of funds. Moreover it has the high solvency index GLOBAS-i®, this fact means that the enterprise is financially stable.
Net profit of enterprises engaged in secondary processing of raw materials in Russia, TOP-10

In addition to the leader of the ranking list, there are 7 industry’s companies which have positive value of net profit, 6 of them have high solvency index. That means the opportunity to repay the liabilities on time and fully.
Two industry’s leaders according to 2012 turnover LLC NLMK Vtorchermet and LLC Severstal Vtorchermet didn't manage to dispose efficiently the received funds and closed the ranking list with negative net profit value. Both companies have satisfactory solvency index GLOBAS-i®, which testifies about the risk of monetary default by enterprises from average to above average.
However it would be incorrect to give the assessment of the enterprise’s efficiency, based only on net profit value. It is necessary to pay attention to other indicators, such as income from sales and profit before tax, for a more accurate and objective analysis.
Russian travel industry shows increase
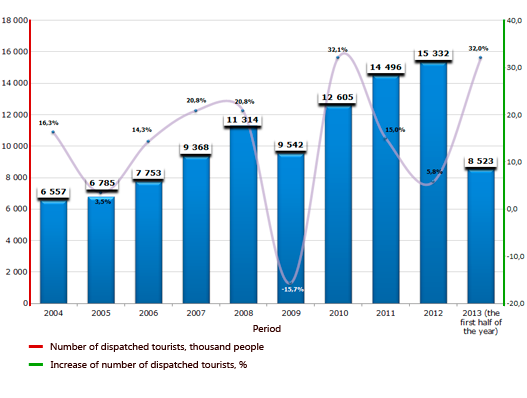
According to Federal tourism agency in the first half of 2013 Russian travel companies (tour operators and travel agencies) has sent 8 million 523 thousand of tourists abroad. This number is 32% higher as compared with the same period of 2012.
Russian international tourism market shows good growth rate. The single exception was 2009, when number of tourists sent abroad shortened on 15,7%. This situation might be connected with financial crisis, when personal income declined and for many people a trip abroad came under the notion of “deferred demand”. In the next two years (2012, 2011) increase of tourist movement amounted to 32,1% (to 12,6 million people) and 15% (to 14,5 million people) respectively. It fully compensated the fall of 2009 and significantly exceeded the index of historical maximum of 2008, when 11,3 million fellow citizens went abroad. Despite relative stabilization of economic situation, the riots in Egypt – the second popular country among our tourists after Turkey, have mildly dampened the market: according to results of 2012 it showed modest rise of 5,8%. However, in 2013 we observe yet another revival in overseas tourist trip demand.

Diagram 1. Dynamic of Russian international tourism, thousand people, %
In whole, taking into account growth in prosperity of citizens, prospects of Russian international tourism market are quite hopeful, considering that the total number of citizens, having spent holidays abroad, still accounts for only 11% of the country’s population.

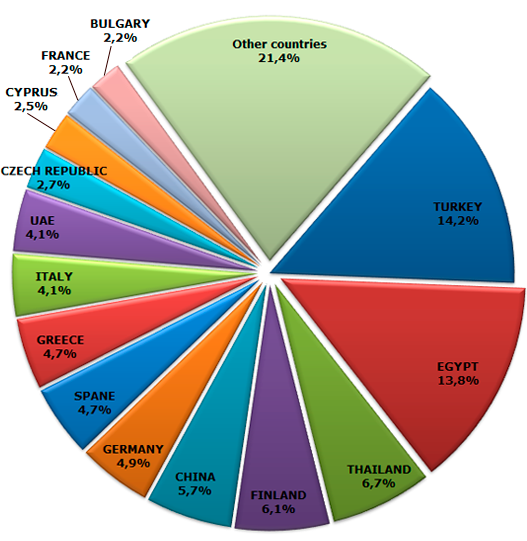
Diagram 2. Main countries that accommodate Russian tourists in the first half 2013, % of the total flow
The structure of Russian international tourism market by countries is displayed on the figure 2. Thus, according to results of the first half of 2013 Turkey maintains the top position with interest of 14,2% of the total tourist movement. All in all 1 213 thousand people visited this country. Then with a slender underrun goes Egypt - 13,9% (1 178 thousand people), Thailand occupies 6,7% of market (571 thousand people), Finland – 6,1% (524 thousand people) and China completes the list of five leaders with interest of 5,7 % (484 thousand people).
At the same time we may see the next tendencies: the number of visits of Turkey during the first half of 2013 in relation to the same period of the preceding year increased on 30%, and of Egypt – on 47%. It may be assumed that such a rapid increase of tourist movement is above all connected to recovery after a sharp slowdown of 2012, when many fellow citizens didn’t take a shot at resting in a popular but riot-hit country. It is safe to say that Egypt may become the first in number of Russians having visited this country according to 2013 results.
Observing tendencies in other directions, one may see that most of the number of tourists visiting Finland has increased on 114% (to 524 thousand people) and Greece – on 96% (to 400 thousand people) all over an analyzable period. In the first case, it is related to growth of interest to “city break tours” to neighboring European country. First of all, among Saint Petersburg residents. In the second case, Greece resorts went down in value after recent economic shocks and became more attractive for our citizens.
Tourism movement has declined more significantly to Lithuania on 55% (to 5 thousand people) and to Slovakia – 37% (to 1 thousand). Among essential directions the number of trips to China have decreased on 15% (to 484 thousand) and to Croatia 15% (to 28 thousand). Talking about China, fall in demand is probably temporary and as for Croatia after introduction of Schengen visa there this direction doesn’t seems to be competitive in comparison with other countries of Mediterranean world.
According to Information and analytical system GLOBAS-i ® of Credinform, today around two thousand companies work in travel services market. At the same time the number of companies that managed to achieve positive financial results for the preceding year turned out to count just over a thousand.
| № | Name | Tax number | Region | Net income, million rubles., 2012. | Solvency index GLOBAS-i ® |
|---|---|---|---|---|---|
| 1 | LLC Megapolyus Gruppa | 7713308496 | Moscow | 533,0 | 289 (high) |
| 2 | JSC MOSTRANSAGENTSTVO | 7701000280 | Moscow | 251,8 | 203 (high) |
| 3 | JSC Primorsky agentstvo aviatsionnykh kompanii | 2540039013 | Primorsky Territory | 92,1 | 200 (high) |
| 4 | LLC S 7 Tour | 7701607660 | Moscow | 56,1 | 280 (high) |
| 5 | LLC Grand Baikal | 3808079832 | Irkutsk region | 53,3 | 182 (the highest) |
| 6 | CJSC Interconnect Management Corporation | 7728580286 | Moscow | 52,0 | 207 (high) |
| 7 | LLC Company TEZ Tour | 7709297570 | Moscow | 39,8 | 222 (high) |
| 8 | JSC Intur-Khabarovsk | 2702032046 | Khabarovsk Territory | 36,1 | 173 (the highest) |
| 9 | LLC Aero Club Tour | 7702520780 | Moscow | 35,6 | 286 (high) |
| 10 | LLC S 7 BILET | 5406194003 | Moscow | 30,8 | 204 (high) |
The majority of top-10 rating of the most profitable travel companies in 2012 is occupied by companies from Moscow. Corresponding situation may happen due to densely populated areas in the megapolis, wide representation of diplomatic missions and special nature of the traffic streams (one of the largest country’s aviation node is situated in the capital; it dispatches and accommodates most of all international flights on the wide circle of directions).
According to independent estimate of the CredInform agency, all the top-10 companies got high and the highest solvency index GLOBAS-i ®. This fact shows that the companies discharge their obligations in due times and to the full extent. The risk of default of them is inconspicuous. Owing to the fact that bankruptcy of travel agencies became more frequent, corresponding index may be useful when you are planning a journey. Recently, company Roskurort from Ekaterinburg and International tour operator “Asent Travel” from Moscow announced its suspension of activities.