
Order a report
Custom-made industry research, company ratings, competitor analysis


Wood processing industry trends
Information agency Credinform presents a review of activity trends of the largest Russian companies in the wood processing industry.
The largest companies in terms of annual revenue for the last reporting periods available in the state statistics bodies and the Federal Tax Service (2011 – 2020) engaged in wooden products manufacture (lumber, plywood, veneer, wooden containers and decking, prefabricated wooden constructions) (TOP 1000) were selected for the analysis. Selection and analysis of companies were carried out based on data from the Information and Analytical system Globas.
Net assets – is a ratio that reflects the real value of the company's property that is calculated annually as the difference between the assets on the company's balance sheet and its debt obligations. The net asset ratio is negative (insufficient property) if the company's debt exceeds the value of its property.
The largest company in the TOP 1000 in terms of net assets is EGGER DREVPRODUKT GAGARIN LLC, INN 6723019741, Smolensk Region, production of plywood, wooden veneered panels and similar layered materials, wood slabs and other lignified materials. In 2020, net assets amounted to almost 25 billion rubles.
The smallest net asset value in the TOP 1000 is RIMBUNAN HIJAU MDF LLC, INN 2721143979, Khabarovsk Territory, logging. Property insufficiency in 2020 was expressed by a negative value of -16 billion RUB.
Covering the ten-year period, average net assets of the industry and their growth rates have an upward trend (Picture 1).
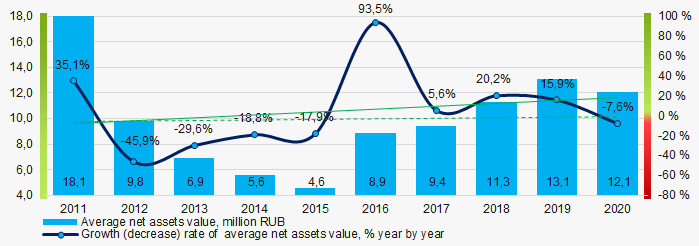 Picture 1. Change in average industry net assets ratios of in 2011-2020
Shares of companies with property insufficiency in the TOP 1000 had a positive downward trend over the past five years (Picture 2).
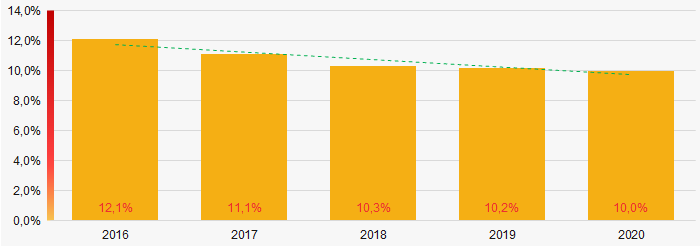 Picture 2. Shares of the TOP 1000 companies with negative net assets in 2016-2020
Sales revenue
The revenue of the top ten companies in 2020 amounted to 28% of the total revenue of the TOP 1000 companies. (Picture 3). This indicates a high level of competition in the industry.
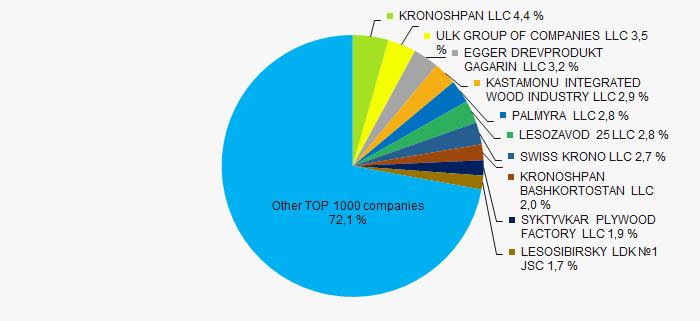 Picture 3. Доли участия компаний ТОП-10 в суммарной выручке 2020 г. ТОП-1000
During the ten-year period, average industry revenue values and their growth rates have been increasing year by year. (Picture 4).
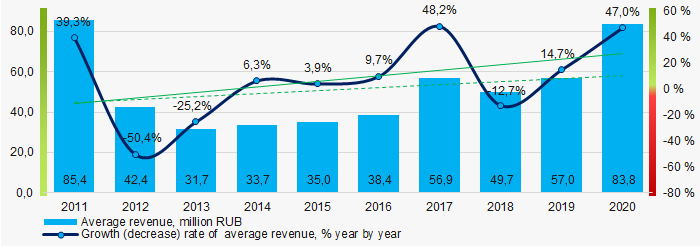 Picture 4. Changes in average industry revenue ratios in 2011-2020
Profit and loss
The largest company in the TOP 1000 in terms of net profit in 2020 is PALMIRA LLC, INN 7811085819, Saint Petersburg, production of wooden containers. The profit amounted to over 6 billion rubles.
Covering the ten-year period, average industry profit values tend to increase. (Picture 5).
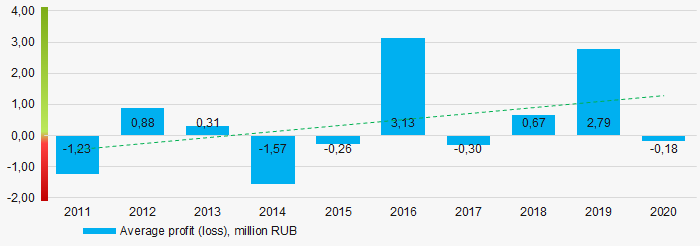 Picture 5. Change in average profit (loss) ratios of the TOP 1000 in 2011-2020
Covering the five-year period, average values of net profit and net loss ratios of TOP 1000 companies tend to increase (Picture 6).
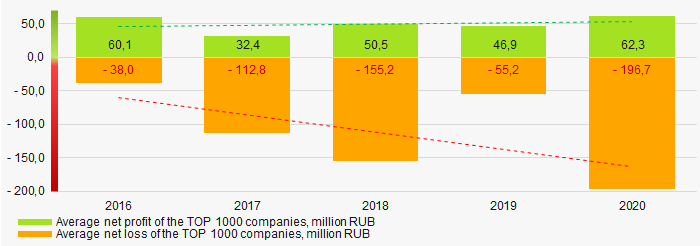 Picture 6. Changes in average values of net profit and net loss ratios of the TOP 1000 companies in 2016-2020
Key financial ratios
Covering the ten-year period, current liquidity ratio average values were in the range of recommended values - from 1.0 to 2.0, with a trend to decrease. (Picture 7).
Current liquidity ratio (current assets to short-term liabilities) shows sufficiency of a company’s assets to settle short-term liabilities.
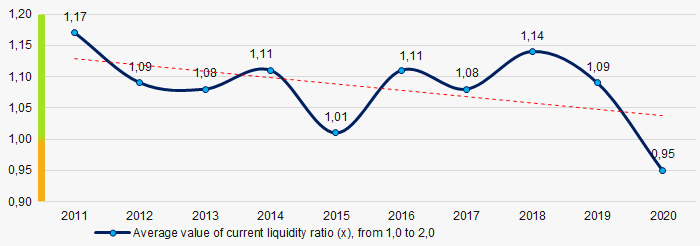 Picture 7. Changes in current liquidity ratio average industry values in 2011-2020
For ten years, average industry indicators of the ROI showed an upward trend. (Picture 8).
This ratio is calculated as ratio of net profit to amount of equity and long-term liabilities and demonstrates return on equity involved in commercial activities and long-term funds raised by organization.
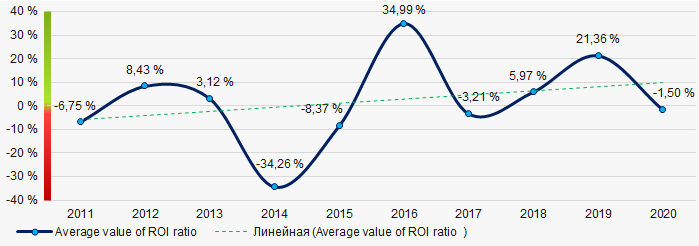 Picture 8. Change in return on investment ratio average values in 2011-2020
Asset turnover ratio is calculated as ratio of sales revenue to average value of total assets for a period and implicates the efficiency of use of all available resources; regardless of the sources, they were raised. The ratio shows how many times per year the full cycle of production and turnover is performed generating the corresponding effect in the form of profit.
Covering the ten years period, values of the said business activity ratio showed a trend to decrease (Picture 9).
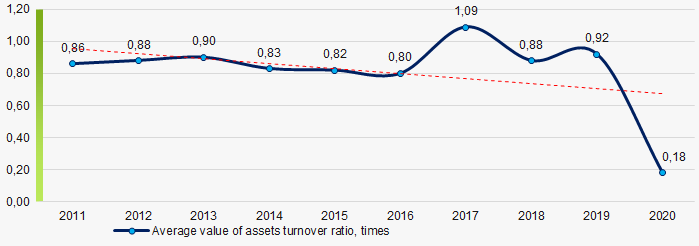 Picture 9. Change in average asset turnover ratio values in 2011-2020
Small enterprises
84% of the TOP 1000 companies are registered in the Unified Register of Small and Medium-Sized Enterprises of the Federal Tax Service of the Russian Federation. At the same time, the share of their revenue in the total revenue of the TOP 1000 in 2020 is over 20%, which is the average for the country in 2018-2019. (Picture 10).
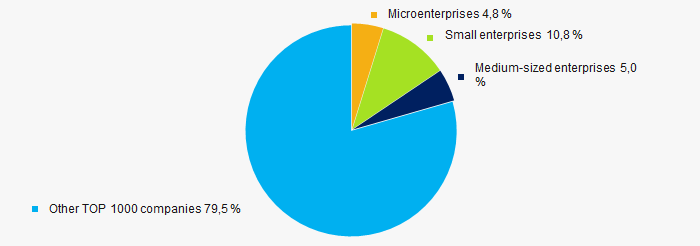 Picture 10. Revenue shares of small and medium-sized enterprises in the TOP-1000
Main regions of activity
The TOP-1000 companies are registered in 69 regions (81% of the subjects of the Russian Federation) and are distributed unevenly across the country. Over 53% of the total revenue of the TOP 1000 companies in 2020 is concentrated in ten regions (Picture 11).
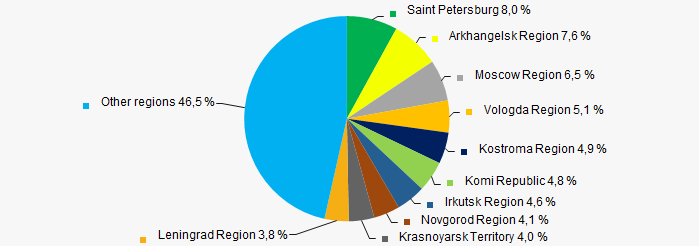 Picture 11. Distribution of the TOP 1000 companies' revenue by Russian regions
Financial position score
Financial position assessment of the TOP 1000 companies shows that the largest part of them is in average financial position. (Picture 12).
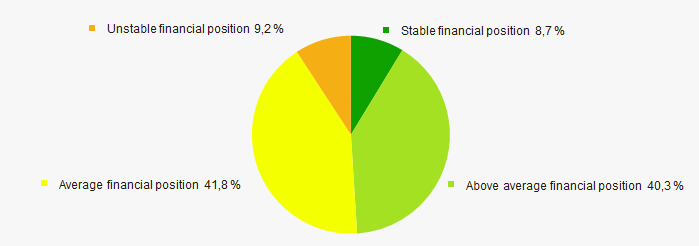 Picture 12. Distribution of TOP-100 companies by financial position score
Globas Solvency Globas
The largest part of the TOP 1000 companies has been assigned superior and high Globas Solvency Index. This indicates their ability to fully meet their debt obligations (Picture 13).
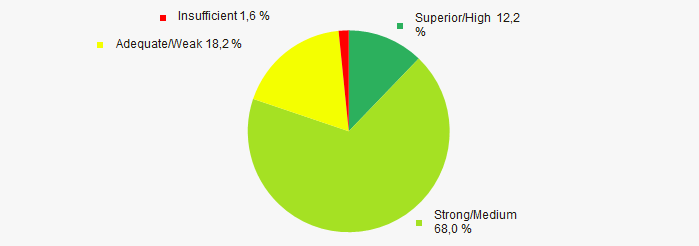 Picture 13. Distribution of the TOP 1000 companies according to the Globas Solvency Index
 Conclusion
A comprehensive assessment of activities of the largest companies in the wood processing industry indicates the predominance of positive trends in their activities in the period from 2011 to 2020. (Table 1).
| Trends and evaluation factors | Share of factor, % |
| Dynamics of average net assets value | |
| Growth (decline) rate in average size of net assets | |
| Increase / decrease in share of enterprises with negative values of net assets | |
| Level of monopolization / competition | |
| Dynamics of average revenue | |
| Growth (decline) rate in average size of revenue | |
| Dynamics of average profit (loss) | |
| Increase / decline in average values of net profit | |
| Increase / decline in average values of net loss | |
| Increase / decrease in average values of current liquidity ratio | |
| Increase / decrease in average values of return on investment ratio | |
| Increase / decrease in average values of asset turnover ratio, times | |
| The share of small and medium-sized enterprises in revenue is more than 20% | |
| Regional concentration | |
| Financial position (the largest share) | |
| Globas Solvency Index (the largest share) | |
| Average value of factors share | |
![]() positive trend (factor),
positive trend (factor), ![]() negative trend (factor)
negative trend (factor)