Capital amnesty is coming to an end
The third stage of capital amnesty, which began on June 1, 2019, will end on February 29. This was the subject of our publication from 27.05.2019 «Capital amnesty has been extended».
It should be recalled, that according to the Federal Law of 08.06.2015 No.140-FZ "On the voluntary declaration of assets by individuals and accounts (deposits) at banks and on amendments to certain legislative Acts of the Russian Federation", the citizens had the opportunity to report about their accounts and deposits, property, shares in the authorized capital of domestic and foreign companies. The capital amnesty was possible only after the repatriation of accounts and enterprises, in other words after the actual return of capital to Russia.
Among new conditions appeared on the third stage are not only transfer of capital to Russia, but also business registration in special administrative regions - Russky Island in Primorsky Krai or Oktyabrsky Island in Kaliningrad. Concessional taxation is provided for the residents of these areas, the data on beneficiaries is available only for management companies, supervisory authorities and courts.
Relief from criminal responsibility was guaranteed by the relevant amendments to the Article 761 of the Criminal Code of the Russian Federation. At the same time, these guarantees were not recorded in the Criminal Procedural Code of the Russian Federation and there were examples of using information from the voluntary declarations on capital amnesty against entrepreneurs.
The Federal Law No. 498-FZ of 27.12.2019 adopted the relevant amendments in order to harmonize the legislation on capital amnesty with the provisions of the Criminal Procedural Code of the Russian Federation.
In particular, it was stated, that submission of a special declaration and information from such declarations could not serve as a reason for initiating a criminal case.
Besides, it is prohibited to withdraw special declarations as well as documents and information attached to them during the investigative actions.
According to the Ministry of Finance, during the previous stages about 20 000 returns have been filed, however the amount of declared funds is a tax secret. The Federal Tax Service does not disclose information about the number of declarations submitted during the third stage of amnesty, but according to the Ministry of Economic Development, 12 new companies were registered in the special administrative regions since June 2019. This is confirmed by Information and Analytical system Globas, at the same time, the total authorized capital of these companies exceeds 200 billion RUB.
Activity trends in IT-companies
Information agency Credinform has observed trends in the activity of the largest Russian IT-companies.
Enterprises with the largest volume of annual revenue (TOP-1000) were selected for the analysis, according to the data from the Statistical Register for the latest available periods (for 2013-2018). The analysis was made on the basis of the data of the Information and Analytical system Globas.
Net assets is an indicator, reflecting the real value of company's property, is calculated annually as the difference between assets on the enterprise balance and its debt obligations. The indicator of net assets is considered negative (insufficiency of property), if company’s debt exceeds the value of its property.
The largest company in terms of net assets amount is LLC MAIL.RU, INN 7743001840, Moscow. In 2018 net assets of the company amounted to more than 129 billion RUB.
LLC STACK DATA NETWORK, INN 7713730490, Moscow, had the smallest amount of net assets in the TOP-1000 group. Case on declaring the company bankrupt (insolvent) is proceeding, supervision since 02.09.2019. Insufficiency of property of the company in 2018 was expressed in negative value -1,2 billion RUB.
For a ten-year period average amount of net assets of TOP-1000 companies has decreasing tendency (Picture 1).
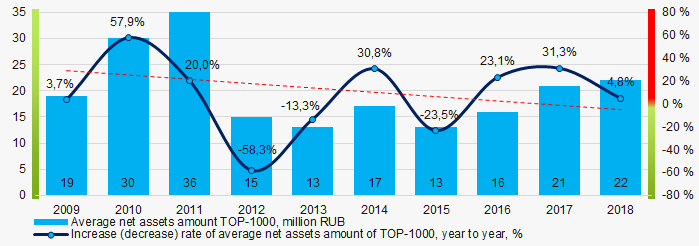 Picture 1. Change in average indicators of the net asset amount in 2009 – 2018
Share of companies with insufficiency of property in the TOP-1000 demonstrate decreasing tendency for the last five years (Picture 2).
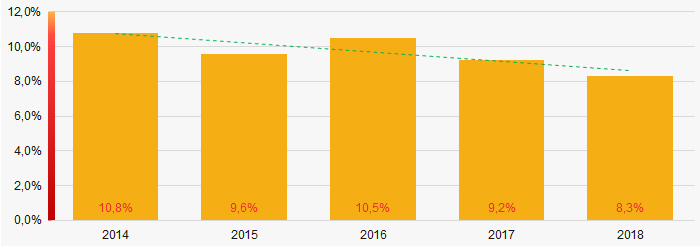 Picture 2. Shares of companies with negative values of net assets in TOP-1000 companies
 Sales revenue
The revenue volume of 10 leaders of the industry made 51% of the total revenue of TOP-1000 companies in 2018 (Picture 3). It demonstrates high level of monopolization.
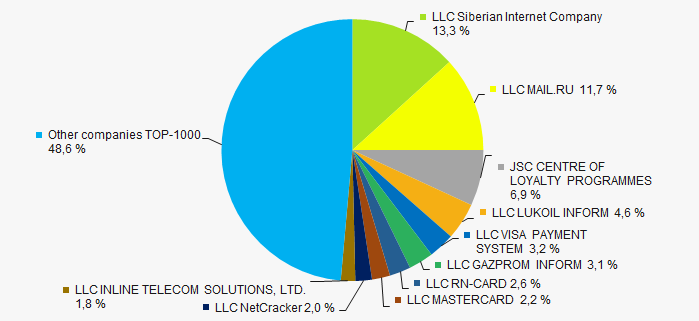 Picture 3. Shares of participation of TOP-10 companies in the total revenue of TOP-1000 companies for 2018
In general, a decreasing tendency in revenue volume is observed (Picture 4).
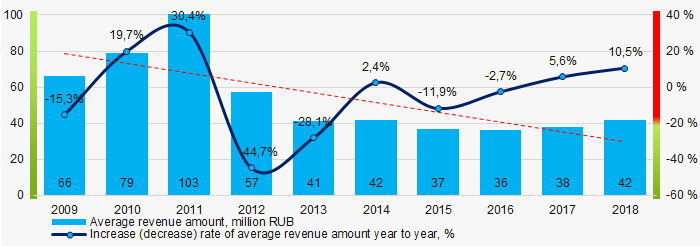 Picture 4. Change in the average revenue of TOP-1000 in 2009 – 2018
Profit and losses
The largest company in terms of net profit amount also is LLC MAIL.RU, INN 7743001840, Moscow. Net profit of the company amounted to 5.8 billion RUB for 2018.
For the five-year period average industrial indicators of net profit in TOP-1000 have decreasing tendency (Picture 5).
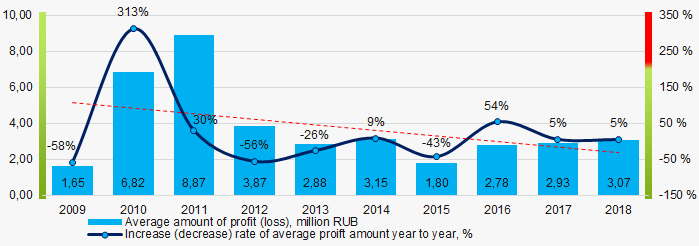 Picture 5. Change in the average indicators of profit (loss) of TOP-1000 companies in 2009 – 2018
Over a five-year period, the average values of net profit indicators of TOP-1000 companies have increasing tendency. Besides, the average value of net loss decreases (Picture 6).
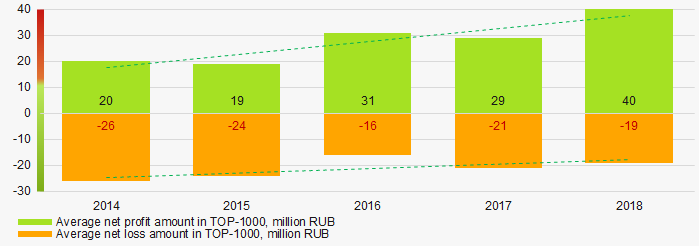 Picture 6. Change in the average indicators of net profit and loss of TOP-1000 companies in 2014 – 2018
Key financial ratios
Over the five-year period the average indicators of the current liquidity ratio were within the range of recommended values – from 1,0 up to 2,0 with increasing tendency (Picture 7).
The current liquidity ratio (the relation of the amount of current assets to short-term liabilities) shows the sufficiency of company’s funds for repayment of its short-term liabilities.
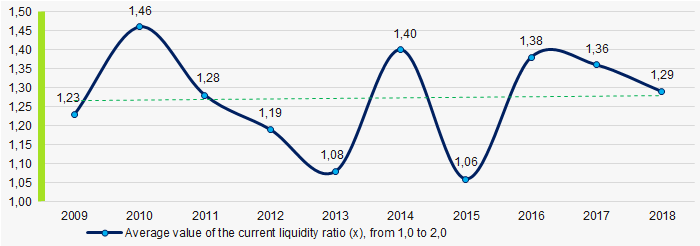 Picture 7. Change in the average values of the current liquidity ratio of TOP-1000 companies in 2009 – 2018
 Average values of the indicators of the return on investment ratio have decreasing tendency for ten years (Picture 8).
The ratio is calculated as the relation of net profit to the sum of own capital and long-term liabilities and demonstrates the return on the equity involved in the commercial activity of own capital and the long-term borrowed funds of an organization.
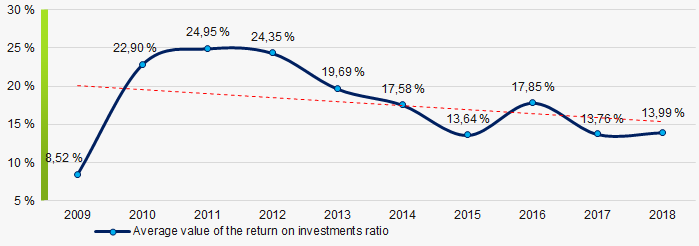 Picture 8. Change in the average values of the return on investment ratio of TOP-1000 companies in 2009 – 2018
 Asset turnover ratio is calculated as the relation of sales revenue to the average value of total assets for a period and characterizes the efficiency of use of all available resources, regardless of the sources of their attraction. The ratio shows how many times a year a complete cycle of production and circulation is made, yielding profit.
This business activity ratio showed a tendency to decrease for a ten-year period (Picture 9).
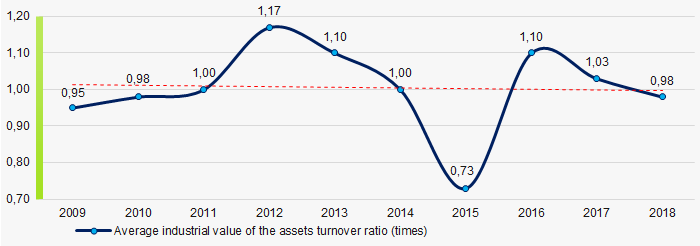 Picture 9. Change in the average values of the assets turnover ratio of TOP-1000 companies in 2009 – 2018
Small business
78% of the TOP-1000 companies are registered in the Register of small and medium enterprises of the Federal Tax Service of the RF. Besides, share of revenue in the total volume is 21,1%, that is equal to the average indicator countrywide (Picture 10).
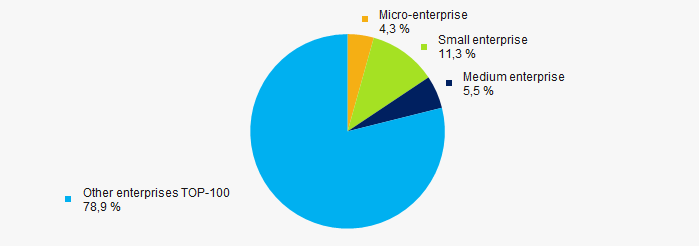 Picture 10. Shares of small and medium enterprises in TOP-1000 companies, %
Main regions of activity
TOP-1000 enterprises are unequally distributed along the territory of Russia and registered in 73 regions. Almost 83% of the largest enterprises in terms of revenue volume is concentrated in Moscow (Picture 11).
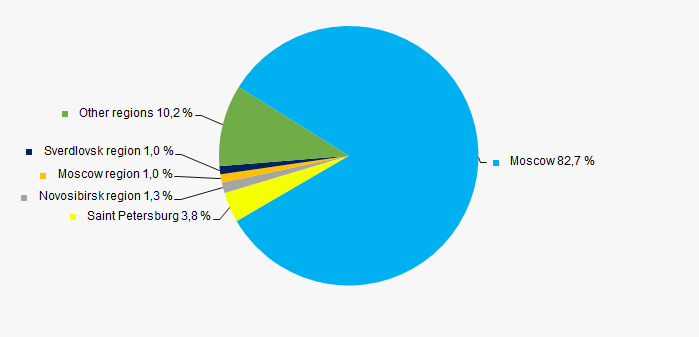 Picture 11. Distribution of TOP-1000 companies by regions of Russia
 Financial position score
An assessment of the financial position of TOP-1000 companies shows that the largest number is in an above average financial position. (Picture 12).
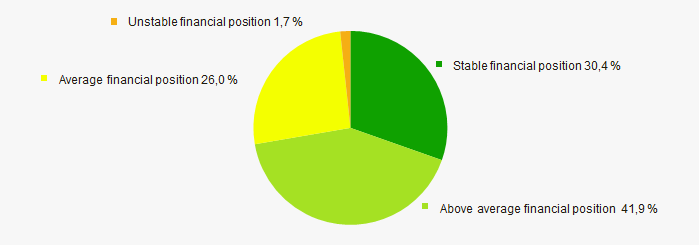 Picture 12. Distribution of TOP-1000 companies by financial position score
Solvency index Globas
Most of TOP-1000 companies have got from Medium to Superior Solvency index Globas, that points to their ability to repay their debts in time and fully (Picture 13).
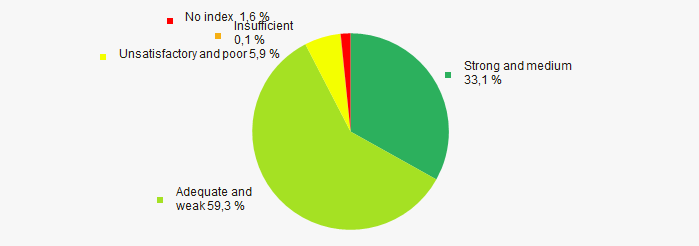 Picture 13. Distribution of TOP-1000 companies by solvency index Globas
Conclusion
Comprehensive assessment of the activity of largest Russian IT-companies taking into account the main indexes, financial indicators and ratios, demonstrates the presence of favorable trends (Table 1).
| Trends and assessment factors | Share of factor, % |
| Rate of increase (decrease) of average amount of net assets |  -10 -10 |
| Increase / decrease of share of companies with negative values of net assets |  10 10 |
| Level of competition |  -10 -10 |
| Increase (decrease) rate of average revenue amount |  -10 -10 |
| Increase (decrease) rate of average net profit (loss) amount |  -10 -10 |
| Increase / decrease of average net profit amount of TOP-1000 companies |  10 10 |
| Increase / decrease of average net loss amount of TOP-1000 companies |  10 10 |
| Increase / decrease of average industrial values of the current liquidity ratio |  10 10 |
| Increase / decrease of average industrial values of the return on investments ratio |  -10 -10 |
| Increase / decrease of average industrial values of the assets turnover ratio, times |  -10 -10 |
| Share of small and medium enterprises in the industry in terms of revenue volume more than 21% |  10 10 |
| Regional concentration |  -10 -10 |
| Financial position (major share) |  10 10 |
| Solvency index Globas (major share) |  10 10 |
| Average value of factors |  0,0 0,0 |
 positive trend (factor),
  negative trend (factor).