
Order a report
Custom-made industry research, company ratings, competitor analysis


Current liquidity ratio of the largest Russian enterprises for growing perennial crops
Information agency Credinform prepared a ranking of the largest Russian enterprises growing perennial crops (grapes, citrus fruits and berries). Companies with the highest volume of revenue (TOP-10) were selected for this ranking according to the data from the Statistical Register for the latest available periods (2015 and 2014). The enterprises were ranked by current liquidity ratio in 2015 (Table 1). The analysis was based on data from the Information and Analytical system Globas®
Current liquidity ratio (x) is calculated as current assets to short-term liabilities of the company and shows the adequacy of the enterprise's funds to pay off its short-term obligations.
The recommended value is from 1.0 to 2.0. The value of the indicator less than 1.0 indicates the excess of current liabilities over current working capital. Thus, the lower interval limit is determined by the need to ensure the adequacy of working capital for the full repayment of short-term obligations. Otherwise, the enterprise faces bankruptcy. However, a significant excess of short-term funds over liabilities may indicate a violation of the capital structure and inefficient or non-rational investment of funds.
Taking into account the actual situation both in economy in general and in sectors, the experts of the Information Agency Credinform have developed and implemented in the Information and Analytical System Globas® the calculation of practical values of financial ratios that can be recognized as normal for a particular industry. The practical value of return on sales ratio for enterprises growing perennial crops in 2015 was from 0,36 to 2,45.
For the most complete and objective view of the financial condition of the enterprise it is necessary to pay attention to the complex of presented ratios, financial and other indicators of the company.
| Name, INN, region | Net profit, 2014, bln RUB | Net profit, 2015, bln RUB | Revenue, 2014, bln RUB | Revenue, 2015, bln RUB | R (х) | Solvency index Globas® |
| 1 | 2 | 3 | 4 | 5 | 6 | 7 |
| JSC COLLECTIVE AGRICULTURAL ENTERPRISE SVETLOGORSKOE INN 2323018810 Krasnodar territory | 51,1 | 136,7 | 356,0 | 476,7 | 7,88 | 156 The highest |
| JSC "Agrofirma Imeny 15 Let Oktyabrya" INN 4811004620 Lipetsk region | 224,7 | 377,0 | 717,8 | 956,0 | 7,59 | 285 High |
| ПPJSC AGRONOM INN 2330018225 Krasnodar territory | 84,5 | 248,6 | 481,8 | 703,0 | 6,36 | 134 The highest |
| OOO AGROFIRMA YUBILEINAYA INN 2352039564 Krasnodar territory | 168,0 | 291,6 | 338,2 | 516,9 | 4,96 | 243 High |
| ООО FANAGORIYA-AGRO INN 2352034020 Krasnodar territory | 92,2 | 165,0 | 348,2 | 396,4 | 4,67 | 195 The highest |
| PJSC SAD-GIGANT INN 2349008492 Krasnodar territory | -209,2 | 453,6 | 1 551,1 | 1 891,4 | 1,52 | 1199 The highest |
| JSC TSENTRALNO-CHERNOZEMNAYA PLODOVO-YAGODNAYA KOMPANIYA INN 3662070125 Voronezh region | 56,3 | 159,4 | 476,4 | 626,3 | 1,15 | 234 High |
| JSC AGROFIRMA YUZHNAYA INN 2352000493 Krasnodar territory | 525,3 | 830,2 | 1 321,3 | 1 924,9 | 0,90 | 199 The highest |
| JSC SOVKHOZ IMENI LENINA INN 5003009032 Moscow region | 391,3 | 1 401,3 | 1 415,8 | 958,5 | 0,90 | 210 High |
| JSC SHP VINOGRADNOE INN 2624022231 Stavropol territory | 0,4 | 1,3 | 610,4 | 598,4 | 0,72 | 245 High |
| Total for the group of companies TOP-10 | 1 384,5 | 4 064,5 | 7 617,0 | 9 048,5 | ||
| Average for the group of companies TOP-10 | 138,4 | 406,5 | 761,7 | 904,8 | 3,67 | |
| Industry average value | 1,2 | 3,3 | 15,9 | 17,2 | 1,24 |
The average value of current liquidity ratio of TOP-10 in 2015 companies is higher than the recommended, practical and average values. Five companies of the TOP-10 have indicators above the upper interval limit of the recommended value, two companies - within the interval and three companies - below the interval values (marked in column 6 of Table 1 and on Picture 1 with yellow, green and red respectively). At the same time, the indicators of the last three companies are within practical limits.
In 2015 all companies of the TOP-10 increased net profit and two companies reduced revenue compared to the previous period (marked with red in column 5 of Table 1).
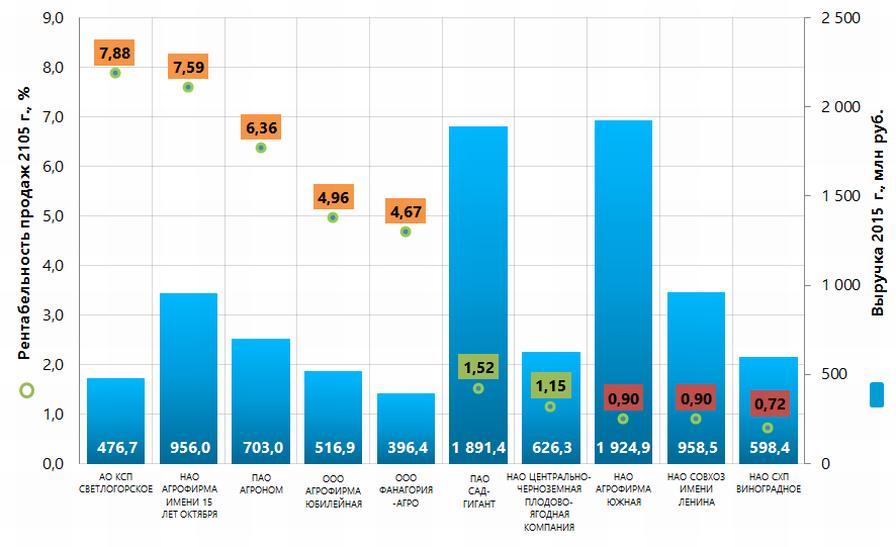 Picture 1. Current liquidity ratio and revenue of the largest Russian enterprises engaged in growing of perennial crops (TOP-10)
The average sectoral indicators of current liquidity ratio (Picture 2) are quite stable and within the recommended range, except 2009 and 2013.
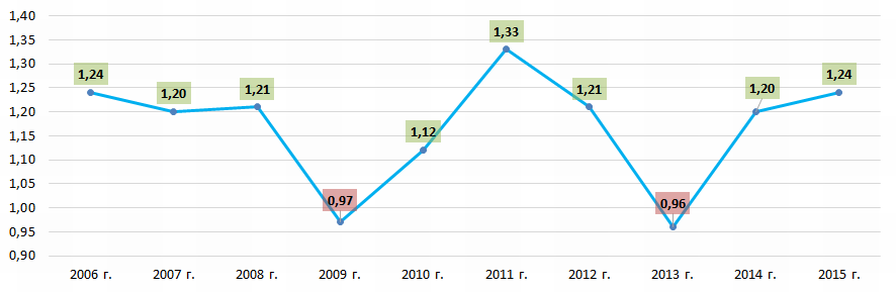 Picture 2. Change in the average sectoral values of profitability of sales ratio of the Russian enterprises engaged in growing of perennial crops in 2006 - 2015
All TOP-10 companies hot high and the highest Solvency index Globas®, which indicates their ability to timely and fully repay their debt obligations.