
Order a report
Custom-made industry research, company ratings, competitor analysis


Trends in light industry
Information agency Credinform has prepared a review of trends of the largest Russian companies of the light industry.
The largest manufacturers of textile, clothes and leather goods (TOP-1000) in terms of annual revenue were selected for the analysis according to the data from the Statistical Register and the Federal Tax Service for the latest available periods (2014-2019). The analysis was based on the data of the Information and Analytical system Globas.
Net assets are total assets less total liabilities. This indicator reflects the real value of the property of an enterprise. When the company’s debt exceeds the value of its property, the indicator is considered negative (insufficiency of property).
The largest company in term of net assets is JSC GLORIA JEANS CORPORATION, INN 6166034397, Rostov region. In 2019, net assets value of the company amounted to 18,6 billion RUB.
The lowest net assets value among TOP-1000 belonged to LLC ZAVOD ELASTIK, INN 1651041168, the Republic of Tatarstan. In 2019, insufficiency of property of the organization was indicated in negative value of -2,0 billion RUB.
Covering the six-year period, the average net assets values have a trend to increase with a decreasing growth rate (Picture 1).
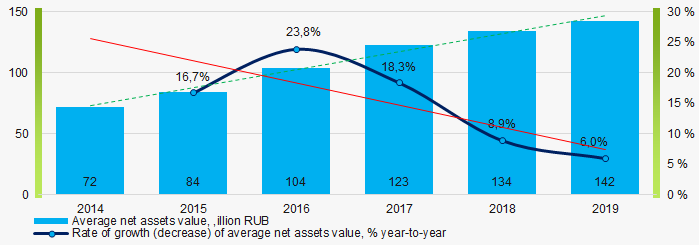 Picture 1. Change in industry average net assets value in 2014 – 2019
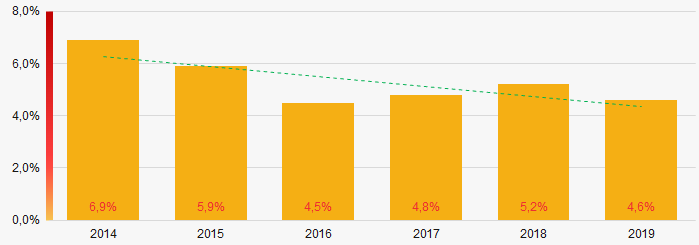
Over the past six years, the share of companies with insufficient property had a trend to decrease (Picture 2).
 Picture 2. Shares of TOP-1000 companies with negative net assets value in 2014-2019
Sales revenue
In 2019, the revenue volume of 10 largest companies of the industry was 29% of total TOP-1000 revenue (Picture 3). This is indicative of relatively high level of competition in the industry.
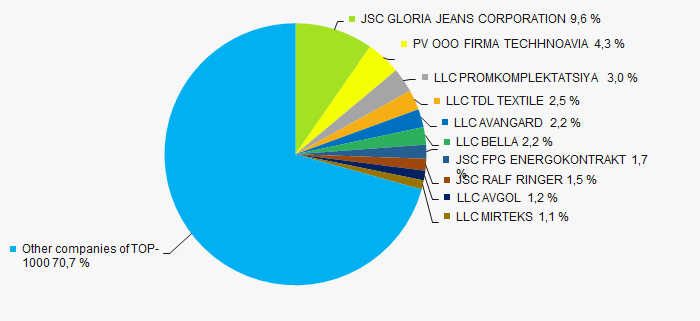 Picture 3. The share of TOP-10 companies in total 2019 revenue of TOP-1000
 In general, there is a trend to increase in revenue with decreasing growth rate (Picture 4).
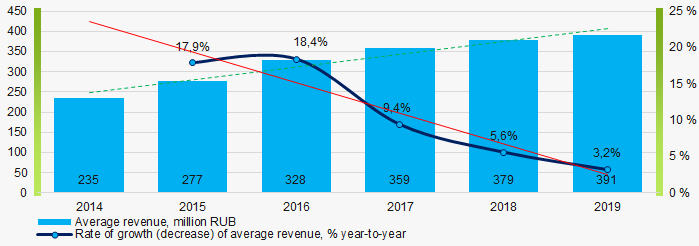 Picture 4. Change in industry average net profit in 2014 – 2019
Profit and loss
The largest organization in term of net profit is PV OOO FIRMA TECHNOAVIA, INN 7724152603, Moscow. The company’s profit for 2019 reached 1,4 billion RUB.
Covering the six-year period, there is a trend to increase in average net profit with decreasing growth rate (Picture 5).
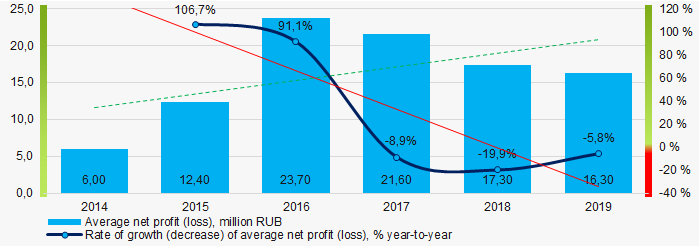 Picture 5. Change in industry average net profit (loss) values in 2014 – 2019
For the six-year period, the average net profit values of TOP-1000 have the increasing trend with the decreasing net loss (Picture 6).
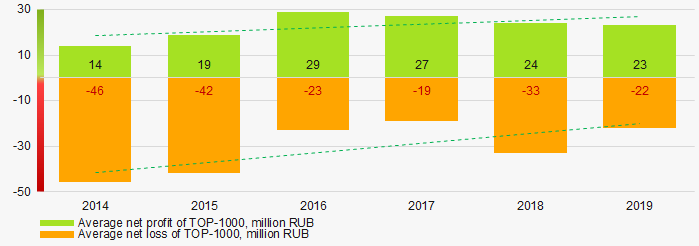 Picture 6. Change in average net profit and net loss of ТОP-1000 in 2014 – 2019
Key financial ratios
Covering the six-year period, the average values of the current liquidity ratio were above the recommended one - from 1,0 to 2,0 with a trend to increase (Picture 7).
Current liquidity ratio (current assets to short-term liabilities) shows the sufficiency of company’s assets to repay on short-term liabilities.
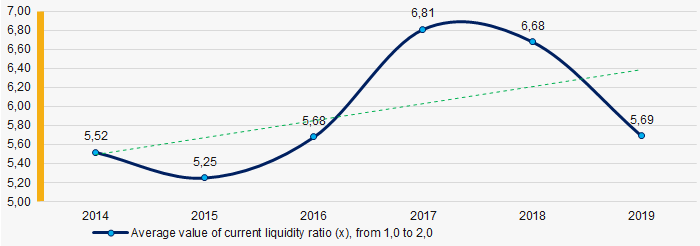 Picture 7. Change in industry average values of current liquidity ratio in 2014 – 2019
 Covering the six-year period, the average values of ROI ratio have a trend to decrease (Picture 8).
ROI ratio is calculated as net profit to sum of shareholders equity and long-term liabilities, and shows the return of equity involved in commercial activities and long-term borrowed funds.
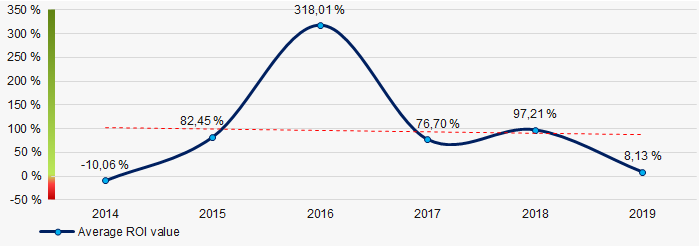 Picture 8. Change in industry average values of ROI ratio in 2014 – 2019
Assets turnover ratio is the ratio of sales revenue and company’s average total assets for a period. It characterizes the effectiveness of using of all available resources, regardless the source of their attraction. The ratio shows how many times per year the full cycle of production and circulation is performed, generating the corresponding effect in the form of profit.
Covering the six-year period, business activity ratio demonstrated the decreasing trend (Picture 9).
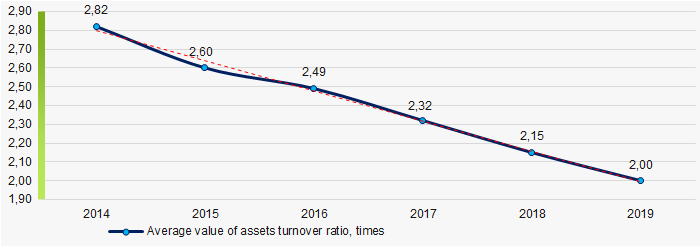 Picture 9. Change in average values of assets turnover ratio in 2014 – 2019
Small business
88% of TOP-1000 organizations are registered in the Register of small and medium-sized enterprises of the Federal Tax Service of the Russian Federation. Their share in total revenue of TOP-1000 is almost 45% that is double the national average in 2018-2019 (Picture 10).
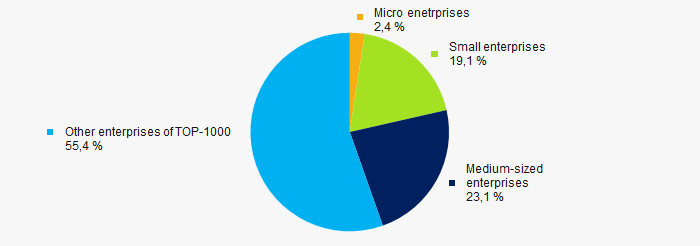 Picture 10. Shares of revenue of small and medium-sized enterprises in TOP-1000
Main regions of activity
Companies of TOP-1000 are registered in 66 regions of Russia, and unequally located across the country. Almost 47% of companies largest by revenue are located in Moscow, Moscow region and Rostov region (Picture 11).
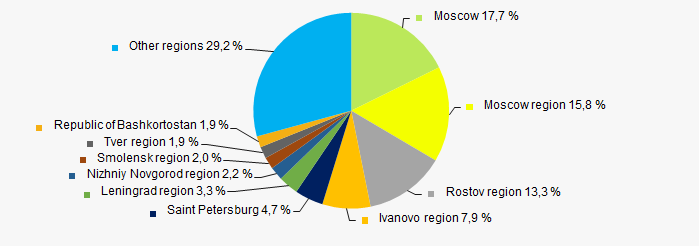 Picture 11. Distribution of TOP-1000 revenue by regions of Russia
Financial position score
Assessment of the financial position of TOP-1000 companies shows that the majority of them have financial position above average (Picture 12).
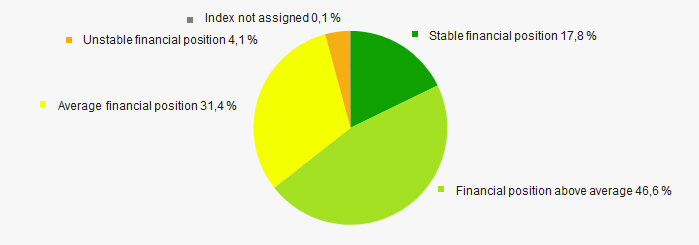 Picture 12. Distribution of TOP-1000 companies by financial position score
Solvency index Globas
Most of TOP-1000 companies got Superior / High and Strong / Medium index Globas. This fact shows their ability to meet their obligations fully (Picture 13).
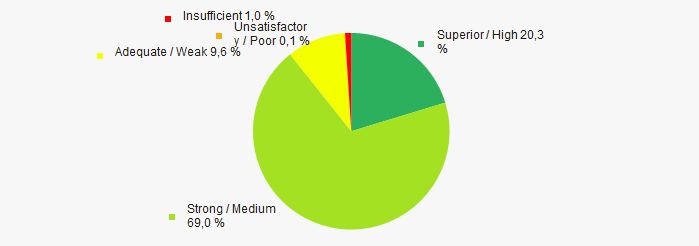 Picture 13. Distribution of TOP-1000 companies by solvency index Globas
Conclusion
Complex assessment of activity of the largest Russian providers of social services, taking into account the main indexes, financial ratios and indicators, demonstrates the prevalence of positive trends in the industry in 2014 - 2019 (Table 1).
| Trends and evaluation factors | Relative share of factors, % |
| Dynamics of the average net assets value | |
| Rate of growth (decrease) in the average size of net assets | |
| Increase (decrease) in the share of enterprises with negative values of net assets | |
| Level of competition / monopolization | |
| Dynamics of the average revenue | |
| Rate of growth (decrease) in the average size of revenue | |
| Dynamics of the average profit (loss) | |
| Rate of growth (decrease) in the average profit (loss) | |
| Growth / decline in average values of companies’ net profit | |
| Growth / decline in average values of companies’ net loss | |
| Increase / decrease in average values of total liquidity ratio | |
| Increase / decrease in average values of return on investment ratio | |
| Increase / decrease in average values of asset turnover ratio, times | |
| Share of small and medium-sized businesses in terms of revenue being more than 22% | |
| Regional concentration | |
| Financial position (the largest share) | |
| Solvency index Globas (the largest share) | |
| Average value of relative share of factors | |
![]() positive trend (factor) ,
positive trend (factor) , ![]() negative trend (factor).
negative trend (factor).