
Order a report
Custom-made industry research, company ratings, competitor analysis


Current liquidity ratio of managing companies
Information agency Credinform presents ranking of the largest Russian holding management companies. Enterprises with the largest volume of annual revenue (TOP-10), engaged in management of holding companies, financial industrial groups and management consultancy, were selected for the analysis, according to the data from the Statistical Register for the latest available periods (for 2015-2017). Then they were ranked by decrease in current liquidity ratio (Table 1). The analysis was made on the basis of the data of the Information and Analytical system Globas.
The current liquidity ratio(х) is calculated as the relation of the sum of working assets to short-term liabilities.
Recommenmded value is from 1,0 to 2,0. Value of the indicator less than 1,0 demonstrates that short-term liabilities exceed current working assets. Therefore, lower limit of the interval reveals need to provide sufficiency of working assets for complete payment of short-term liabilities. Otherwise, it may cause bankruptcy of an enterprise. However, significant increase of short-term assets over liabilities can demonstrate impairment of capital structure and irrational investments of funds.
The experts of the Information agency Credinform, taking into account the actual situation both in the economy as a whole and in sectors, has developed and implemented in the Information and Analytical system Globas the calculation of practical values of financial ratios that can be recognized as normal for a particular industry. For holding management companies practical value of the current liquidity ratio amounted from 0,71 to 5,17 in 2017.
For getting of the most comprehensive and fair picture of the financial standing of an enterprise it is necessary to pay attention to all combination of indicators and financial ratios.
| Name, INN, region | Revenue, billion RUB | Net profit (loss), billion RUB | Current liquidity rsatio (x), from 1,0 to 2,0 | Solvency index Globas | ||||||
| 2016 | 2017 | 2018* | 2016 | 2017 | 2018* | 2016 | 2017 | 2018* | ||
| 1 | 2 | 3 | 4 | 5 | 6 | 7 | 8 | 9 | 10 | 11 |
| AO ROSNEFTEGAZ INN 7705630445 Moscow |
|
|
|
|
|
|
|
|
|
175 High |
| JSC RUSSIAN GRIDS INN 7728662669 Moscow |
|
|
|
|
|
|
|
|
|
226 Strong |
| JSC RUSSIAN HELICOPTERS INN 7731559044 Moscow |
|
|
|
|
|
|
|
|
|
148 Superior |
| JSC CONCERN RADIO-ELECTRONIC TECHNOLOGIES INN 7703695246 Moscow |
|
|
|
|
|
|
|
|
|
151 Superior |
| JSC United Engine Corporation INN 7731644035 Moscow |
|
|
|
|
|
|
|
|
|
158 Superior |
| LLC SET - SVYAZNOY INN 7714617793 Moscow |
|
|
|
|
|
|
|
|
|
299 Medium |
| JSC Voentorg INN 7704726183 Moscow |
|
|
|
|
|
|
|
|
|
210 Strong |
| LLC BUSINESS-FINANCE INN 7707572492 Moscow |
|
|
|
|
|
|
|
|
|
269 Medium |
| LLC PROCTER & GAMBLE INN 7701032910 Moscow |
|
|
|
|
|
|
|
|
|
196 High |
| JSC HOLDING COMPANY METALLOINVEST INN 7705392230 Moscow |
|
|
|
|
|
|
|
|
|
271 Medium |
| Total for TOP-10 companies | |
|
|
|
|
|
||||
| Average value for TOP-10 companies | |
|
|
|
|
|
|
|
32,06 | |
| Average industrial value | |
|
|
|
|
|
||||
*) data for 2018 are given for reference
![]() growth decrease of indicator to the previous period,
growth decrease of indicator to the previous period, ![]() decrease of indicator to the previous period
decrease of indicator to the previous period
Average value of the current liquidity ratio of the TOP-10 group is significantly higher than the average industrial, recommended and practical values of 2017. Five companies have shown results within the interval of the recommended value in 2018.
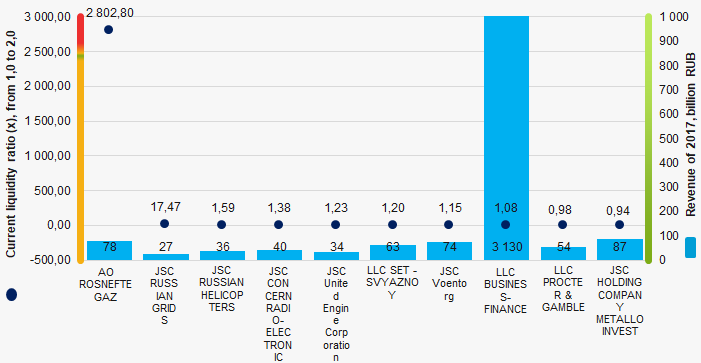 Picture 1. Current liquidity ratio and revenue of the largest Russian holding management companies (TOP-10)
Over a ten-year period average industrial values of the current liquidity ratio were, in general, within the interval of recommended values with increasing tendency. (Picture 2).
 Picture 2. Change in the average industrial values of the current liquidity ratio of Russian holding management companies in 2008 – 2017