Mining industry of the Ural Federal District
Information agency Credinform has prepared a review of activity trends of the largest companies within mining industry of the Ural Federal District. The largest companies (ТОP-500) in terms of annual revenue were selected according to the data from the Statistical Register for the latest available periods (2013 - 2018). The analysis was based on data of the Information and Analytical system Globas.
Net assets is a ratio reflecting the real value of company's property. It is calculated annually as the difference between assets on the enterprise balance and its debt obligations. The ratio is considered negative (insufficiency of property), if company’s debt exceeds the value of its property.
The largest mining company in terms of net assets is JSC SURGUTNEFTEGAS, INN 8602060555, Khanty-Mansiysk Autonomous Okrug - Ugra. In 2018 net assets of the company amounted to 4282 billion RUB.
The smallest size of net assets in TOP-500 had JSC YAMAL LNG, INN 7709602713, Yamalo-Nenets Autonomous Okrug. The lack of property of the company in 2018 was expressed in negative terms -266,8 billion RUB.
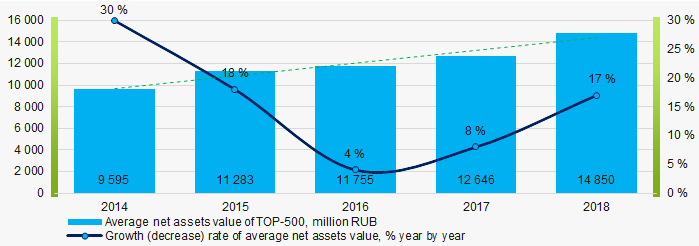
For the last ten years, the average values of net assets showed the growing tendency (Picture 1).
 Picture 1. Change in TOP-500 average net assets value in 2014 – 2018
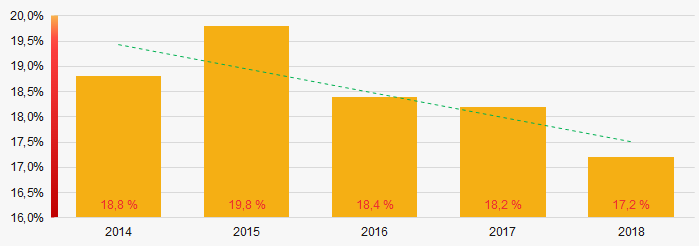
 For the last five years, the share of ТОP-500 enterprises with lack of property showed the decreasing tendency (Picture 2).
 Picture 2. The share of enterprises with negative net assets value in ТОP-500
Sales revenue
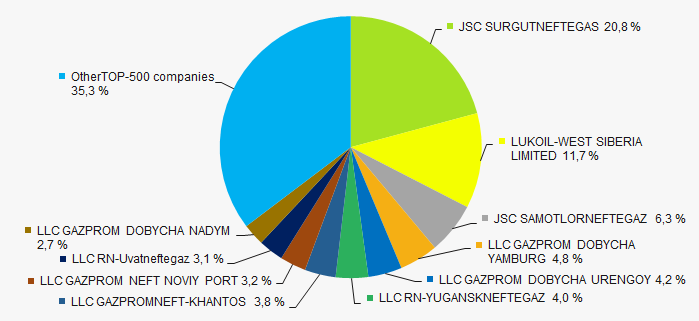
In 2018, the total revenue of 10 largest companies amounted to almost 65% from ТОP-500 total revenue (Picture 3). This fact testifies the high level of monopolization in mining industry of the Ural region.
 Picture 3. Shares of TOP-10 in TOP-500 total revenue for 2018
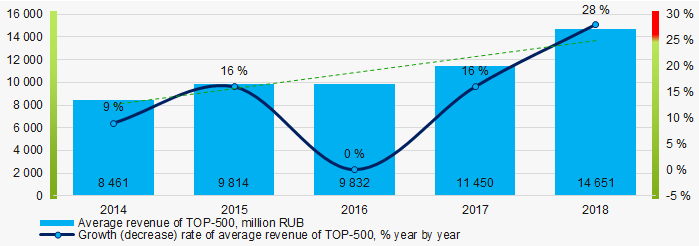
In general, the growing trend in sales revenue is observed (Picture 4).
 Picture 4. Change in average revenue of TOP-500 in 2014 – 2018
Profit and loss
The largest company in terms of net profit is also JSC SURGUTNEFTEGAS, INN 8602060555, Khanty-Mansiysk Autonomous Okrug - Ugra. In 2018 the company’s profit amounted to 827,6 billion RUB.
For the last five years, the profit values of TOP-500 companies showed the increasing tendency (Picture 5).
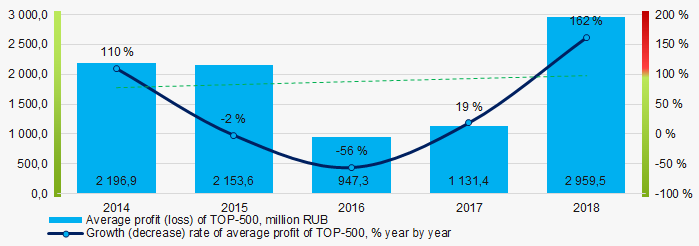 Picture 5. Change in average profit (loss) of TOP-500 in 2014 – 2018
Over a five-year period, the average net profit values of ТОP-500 show the decreasing tendency, along with this the average net loss is increasing (Picture 6).
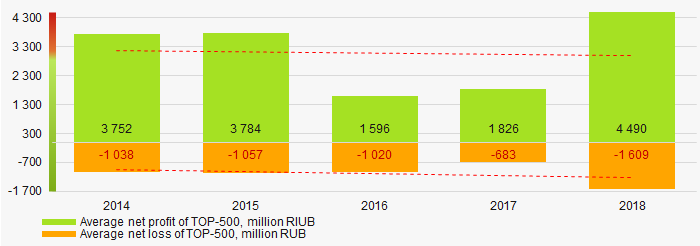 Picture 6. Change in average net profit/loss of ТОP-500 companies in 2014 – 2018
Main financial ratios
For the last five years, the average values of the current liquidity ratio were higher than the recommended values - from 1,0 to 2,0, with increasing tendency (Picture 7).
The current liquidity ratio (ratio of total working capital to short-term liabilities) shows the sufficiency of company’s assets to meet short-term obligations.
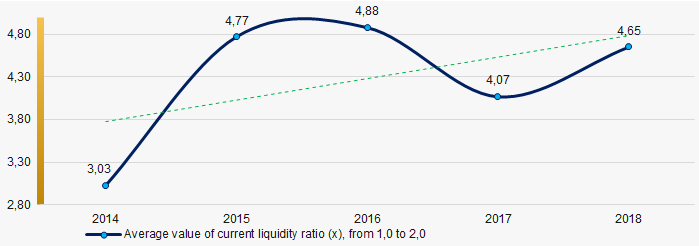 Picture 7. Change in average values of current liquidity ratio in 2014 – 2018
For the last five years, the high level of average values of ROI ratio with growing tendency is observed (Picture 8).
The ROI ratio is calculated as a ratio of net profit to sum of stockholder equity and long-term liabilities and shows the return from equity involved in commercial activities and long-term borrowed funds.
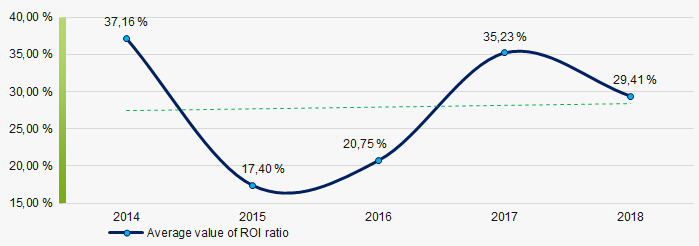 Picture 8. Change in average values of ROI ratio in 2014 – 2018
Assets turnover ratio is the ratio of sales revenue and company’s average total assets for a period. It characterizes the effectiveness of using of all available resources, regardless the source of their attraction. The ratio shows how many times per year the full cycle of production and circulation is performed, generating the corresponding effect in the form of profit.
For the last five years, this business activity ratio demonstrated the downward trend (Picture 9).
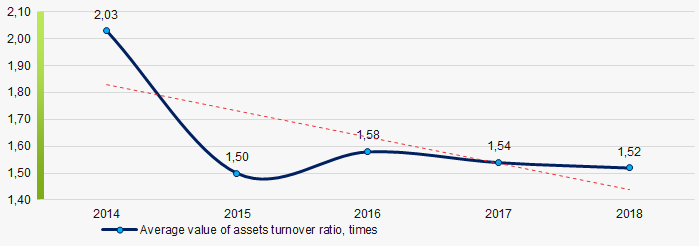 Picture 9. Change in average values of assets turnover ratio in 2014 – 2018
 Small businesses
63% of ТОP-500 companies are registered in the Unified register of small and medium-sized enterprises of the Russian Federal Tax Service. Herein, their share in TOP-500 total revenue amounted to 0,41%, which is significantly lower than national average value (Picture 10).
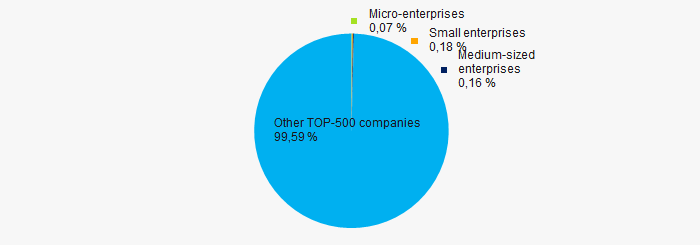 Picture 10. Shares of small and medium-sized enterprises in ТОP-500
Main regions of activity
ТОP-500 companies are registered in 6 regions and unequally located across the country, taking into account the geographical location. More than 94% of the largest enterprises in terms of revenue are located in Khanty-Mansiysk Autonomous Okrug - Ugra and Yamalo-Nenets Autonomous Okrug (Picture 11).
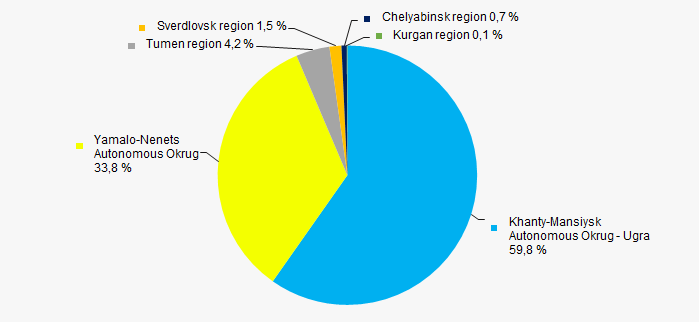 Picture 11. Distribution of TOP-500 revenue by regions of the Ural Federal District
Financial position score
An assessment of the financial position of TOP-500 companies shows that the largest part have the average financial position (Picture 12).
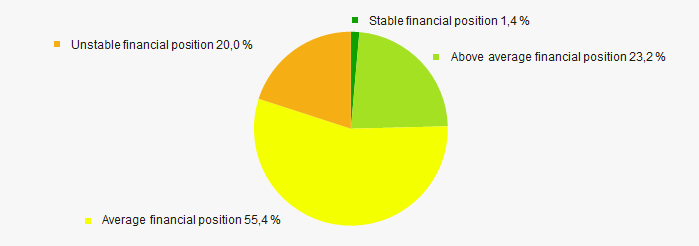 Picture 12. Distribution of TOP-500 companies by financial position score
Solvency index Globas
Most of TOP-500 companies got superior/high or strong/medium Solvency index Globas, this fact shows the ability of the companies to meet their obligations in time and fully (Picture 13).
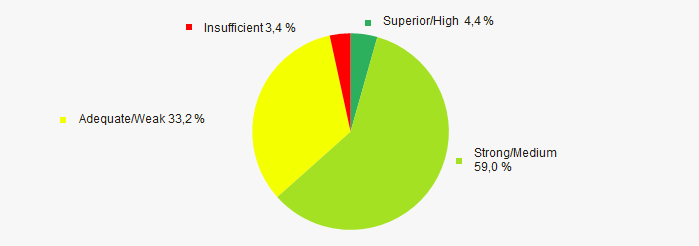 Picture 13. Distribution of TOP-500 companies by Solvency index Globas
Industrial production index
According to the Federal Service of State Statistics, the growing tendency of industrial production index is observed in the Ural Federal District during 12 months of 2018 – 2019 (Picture 14). Herewith the average index from month to month amounted to 100,2%.
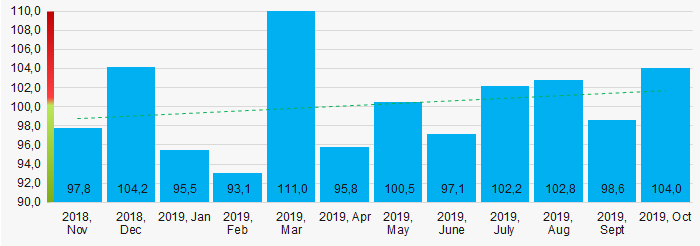 Picture 14. Industrial production index in the Ural Federal District in 2018-2019, month by month (%)
Conclusion
A complex assessment of the largest companies within mining industry of the Ural Federal District, taking into account the main indexes, financial ratios and indicators, demonstrates the presence of positive trends (Table 1).
| Trends and assessment factors | Relative share, % |
| Growth/drawdown rate of average net assets value |  10 10 |
| Increase / decrease in the share of enterprises with negative net assets |  10 10 |
| The level of competition / monopolization |  -10 -10 |
| Growth/drawdown rate of average revenue |  10 10 |
| Growth/drawdown rate of average net profit (loss) |  10 10 |
| Increase / decrease in average net profit |  -10 -10 |
| Increase / decrease in average net loss |  -10 -10 |
| Increase / decrease in average values of current liquidity ratio |  5 5 |
| Increase / decrease in average values of ROI ratio |  10 10 |
| Increase / decrease in average values of assets turnover ratio, times |  -10 -10 |
| Share of small and medium-sized businesses by revenue more than 22% |  -10 -10 |
| Regional concentration |  -10 -10 |
| Financial position (the largest share) |  10 10 |
| Solvency index Globas (the largest share) |  10 10 |
| Industrial production index |  10 10 |
| Average value of factors |  1,3 1,3 |
 favorable trend (factor),
  unfavorable trend (factor).
Top-10 outsider companies of the year
Ending year was marked with the exit from the market of the large business representatives, operating in different economic sectors: from diamond mining to electronics multiple stores. Table 1 contains information about the largest companies in terms of revenue volume, started winding up procedure in 2019.
Companies entered liquidation both on voluntary basis, by taking decision by participants or shareholders, and by compulsory proceedings – as a result of bankruptcy. Liquidation in the form of reorganization (merging or acquisition) was not considered within this research.
In general, analysis of enterprises included in the ranking let define following reasons of winding up, that can be extrapolated to the economy:
- winding up because of assets consolidation by shareholder;
- loss of market because of competitive activity;
- extreme niche specialization: affected by variable environment companies are not able to cross over to output other products/services;
- inability to fulfill obligations to contractors;
- reputational loss because of participation in illegal transactions.
| Rank | Company | Legal status | Revenue, 2018 billion RUB | Activity | Main reason of winding up |
| 1 | JSC ALROSA - Nurba | Process of being wound up, 13.11.2019 | 44,1 | Development of new diamond fields of Nakyn kimberlite field | Voluntary winding up by the decision of extraordinary shareholders` meeting. Market consolidation by parent company JSC ALROSA |
| 2 | LLC GAZPROM GAZENERGOSET | Process of being wound up , 26.04.2019 | 20,2 | Sale of oil, gas condensate of oil processed products | Voluntary winding up by the decision of extraordinary shareholders` meeting. Market consolidation by parent company LLC GAZPROM MEZHREGIONGAZ |
| 3 | JSC ZHIROVOI COMBINAT | Process of being wound up , 03.04.2019 | 19,9 | Manufacture of mayonnaise sauce and margarine, ТМ Saratov provansal | By sole shareholder was taken a decision on winding up because of the inability to pay debts to creditors: JSC Rosselkhozbank and LLC Rusagro group |
| 4 | JSC FOREIGN TRADE COMPANY FOODLINE | Process of being wound up , 28.03.2019 | 7,3 | Import of food products from EU countries | Voluntary winding up by the decision of extraordinary shareholders` meeting. Food embargo, that Russia in 2014 imposed on western countries; 80% of business accounted for foreign contracts. As a result of counter sanctions revenue has more than three times decreased. |
| 5 | LLC BP KZ-KURSK | Process of being wound up , 08.02.2019 | 6,7 | Meat processing production | Declared bankrupt |
| 6 | LLC INGKA SENTERS RUS PROPERTIE | Process of being wound up , 19.11.2019 | 5,9 | Interior design in IKEA multiple stores | Voluntary winding up by the decision of extraordinary shareholders` meeting. Corruption charged (commercial bribery) of manager of the company |
| 7 | LLC KEY | Process of being wound up, 28.06.2019 | 4,8 | Saint-Petersburg electronics multiple stores KEY | Voluntary winding up by the decision of extraordinary shareholders` meeting. Market consolidation by competitor of LLC DNS RETAIL (brand DNS) |
| 8 | LLC UNITED PRODUCTION COMPANY | Process of being wound up, 10.12.2019 | 3,9 | Supply of production equipment: cables, transmitters, automation devices | - |
| 9 | LLC SK STRATEGIYA | In Process of being wound up, 23.04.2019 | 3,9 | Construction of accommodation units in Moscow | Declared bankrupt |
| 10 | LLC VELES-GRUPP | Process of being wound up, 18.07.2019 | 3,8 | Distribution and logistics of basic goods for multiple stores | Decision on winding up was taken by sole shareholder |
Apart from the above mentioned reasons, companies are being wound up compulsorily by the decision of the Federal Tax Service of Russia. Main reason is non-delivery of tax accounts or non-correction of unreliable data to the Unified Register of Legal entities of Russia. However, this information concerns more shell or left off companies, and not active companies.