Herald
Globas helps to avoid sanctions risks

Globas contains information about companies and individuals in all countries in respect of which restrictions have been introduced. It is possible to automatically check the entry of a Russian company into the lists, identify beneficial owners, and assess risks.

The advantages of Globas tools for the sanctions risks prevention are as follows:

  • separate search by a person;
  • search on the list using diverse filters;
  • promptly update of the sanctions list;
  • detailed description of sanctions programs;
  • check through the sanctions list is included in the subscription.

FACTS ABOUT SANCTIONS

Paradoxically, large financial losses from the sanctions are incurred by companies from countries that are not under the sanctions.

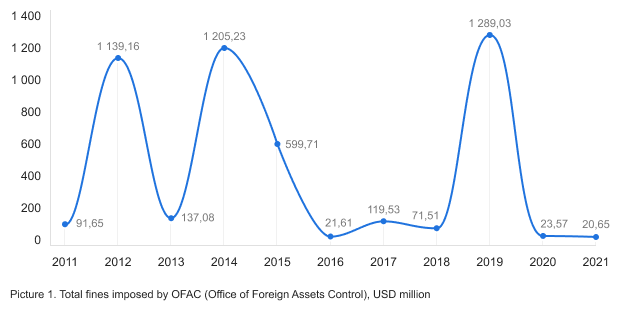
For 10 years from 2011 to 2021, OFAC (Office of Foreign Assets Control) fines for violation of the imposed sanctions and restrictions amounted to USD 4,7 billion.

The largest fines were imposed on BNP Paribas SA, France (USD 963 million), Standard Chartered Bank, Hong Kong (USD 657 million) and ING Bank N.V., Netherlands (USD 619 million).

The highest amount of fines of USD 1,289.03 million was recorded in 2019 (see Picture 1)

Sanctions lists in Globas are based on the official governmental sources:

  • Russia –Government of the Russian Federation; Security Council, Federal Assembly.
    The main law governing the application of sanctions or special economic measures is the Federal Law "On Special Economic Measures" (No. 281-FL dated December 30, 2006) - the main document governing the application of sanctions by Russia in order to ensure the security or hostile actions of other countries or personalities;
  • European Union - European Commission;
  • Great Britain - UK Government;
  • USA - U.S. Department of the Treasury; Department of Commerce – Bureau of Industry and Security (BIS); Department of State – Bureau of International Security and Non-Proliferation; Department of State – Directorate of Defense Trade Controls; OFAC (Office of Foreign Assets Control);
  • Ukraine - Ministry of Economy of Ukraine;
  • other countries (Canada, Switzerland, Australia, etc.) – information from official departments, open sources and media.

Globas contains the unified list of companies, persons, air transport, ports and vessels under the sanctions or restrictive measures imposed by Russia, the USA, the European Union, Great Britain and other countries.

We will tell you more about the possibilities of the Information and Analytical system Globas, in particular about My Lists and Lists we recommend for sanctions check, at the webinar, which will take place on January 19, 2022.

Article
TOP-1000 logging companies

According to the Federal Forestry Agency (Rosleshoz), 128 million cubic meters of wood were logged in Russia within 9 months of 2021, which is by 7,8 million cubic meters greater comparing with the corresponding period of 2020. However, the prices on construction materials have spiked in 2021, especially during the period of summer houses building. The Government of Russia plans to prohibit the export of round coniferous timber starting from 2022. It will help to improve the situation in logging, where the negative development trends were observed in 2011-2020.

The most significant negative trends are: decrease in volumes of revenue and profit, increasing unprofitability, decline in current liquidity ratio and assets turnover ratio. The positive trends are as follows: decrease in share of companies with insufficiency of property, high level of industry competition, as well as considerable volume of goods, produced by a small business.

In order to make the analysis of activity trends in this field, Information agency Credinform selected the largest enterprises (TOP-100) in terms of annual revenue according to the data from the Statistical Register and the Federal Tax Service for the accounting periods (2011 – 2020) in the Information and Analytical system Globas.

Net assets are total assets less total liabilities. This indicator reflects the real value of the property of an enterprise. When the company’s debt exceeds the value of its property, the indicator is considered negative (insufficiency of property).

The largest company in term of net assets is JSC DALLESPROM, INN 2700000070, Khabarovsk territory. In 2020, net assets value amounted to more than 4,2 billion RUB.

The lowest net assets value among TOP-1000 was recorded for OOO KHENDA – SIBIR, INN 5402159093, Tomsk region. In 2020, insufficiency of property was indicated in negative value of -15,8 billion RUB.

During ten-year period, the average net assets values have a trend to decrease (Picture 1).

Picture 1. Change in average industry net assets value 2011- 2020 Picture 1. Change in average industry net assets value 2011- 2020

The shares of TOP-1000 enterprises with insufficient property had a positive trend to decrease during last 5 years (Picture 2).

Picture 2. Shares of TOP-1000 companies with negative net assets values in 2016 - 2020 Picture 2. Shares of TOP-1000 companies with negative net assets values in 2016 - 2020

Sales revenue
The revenue volume of the ten leading companies amounted to 29% of the total revenue of TOP-1000 companies in 2020 (Picture 3). It gives evidence to a relatively high level of the competition among logging companies.

Picture 3. Shares of TOP-10 companies in the total revenue of TOP-1000 in 2020 Picture 3. Shares of TOP-10 companies in the total revenue of TOP-1000 in 2020

Within ten years the average industry revenue were decreasing with increasing growth rates year to year (Picture 4).

Picture 4. Change in average industry revenue in 2011– 2020 Picture 4. Change in average industry revenue in 2011– 2020

Profit and loss
The largest TOP-1000 company in 2020 in term of net profit is OOO PKP TITAN, INN 2901008961, Arkhangelsk region. The company’s profit amounted to 725 billion RUB.

During ten-year period, average industry profit figures were not at the high level and have a trend to decrease (Picture 5).

Picture 5. Change in average industry profit (loss) in 2011- 2020 Picture 5. Change in average industry profit (loss) in 2011- 2020

During five-year period, the average net profit figures of TOP-1000 companies were decreasing, whereas the average net loss was increasing (Picture 6)..

Picture 6. Change in average net profit and net loss of ТОP-1000 companies in 2016 – 2020 Picture 6. Change in average net profit and net loss of ТОP-1000 companies in 2016 – 2020

Key financial ratios
During ten-year period, the average industry values of the current liquidity ratio were generally below the recommended ones – from 1,0 to 2,0, with a trend to decrease. (Picture 7).

Current liquidity ratio (current assets to short-term liabilities) shows the sufficiency of company’s assets to repay on short-term liabilities.

Picture 7. Change in average industry values of current liquidity ratio in 2011 – 2020 Picture 7. Change in average industry values of current liquidity ratio in 2011 – 2020

During ten years, there was a trend to increase in the average ROI values (Picture 8).

ROI ratio is calculated as net profit to sum of shareholders equity and long-term liabilities, and shows the return of equity involved in commercial activities and long-term borrowed funds.

Picture 8. Change in average industry values of ROI ratio in 2011 – 2020 Picture 8. Change in average industry values of ROI ratio in 2011 – 2020

Assets turnover ratio is the ratio of sales revenue and company’s average total assets for a period. It characterizes the effectiveness of using of all available resources, regardless the source of their attraction. The ratio shows how many times per year the full cycle of production and circulation is performed, generating the corresponding effect in the form of profit.

During the ten-year period, there was a trend to decrease of this ratio (Picture 9).

Picture 9. Change in average industry values of assets turnover ratio in 2011 - 2020 Picture 9. Change in average industry values of assets turnover ratio in 2011 - 2020

Small enterprises
91% companies of TOP-1000 are registered in the Register of small and medium-sized enterprises of the Federal Tax Service of the Russian Federation. However, their share in total revenue of TOP-1000 in 2020 amounted to almost 50%, which is more than twice as great as the average country values in 2018 - 2019 (Picture 10).

Picture 10. Shares of small and medium-sized enterprises in TOP-100 Picture 10. Shares of small and medium-sized enterprises in TOP-100

Main regions of activity
Companies of TOP-100 are registered in 59 regions of Russia (69% of member states of Russia), and unequally located across the country due to the geographic location of forest resources. Almost 45% of the TOP-1000 companies’ total revenue for 2020 consolidate in Vologda, Arkhangelsk, Irkutsk regions and in Krasnoyarsk territory (Picture 11).

Picture 11. Distribution of TOP-1000 revenue by the regions of Russia Picture 11. Distribution of TOP-1000 revenue by the regions of Russia

Financial position score
According to the assessment, the financial position of most of TOP-1000 companies is average (Picture 12).

Picture 12. Distribution of TOP-100 companies by financial position score Picture 12. Distribution of TOP-100 companies by financial position score

Solvency index Globas
Most of TOP-1000 companies got Superior / High and Strong / Medium index Globas. This fact shows their ability to meet their obligations fully and by the due date (Picture 13).

Picture 13. 13. Distribution of TOP-1000 companies by solvency index Globas Picture 13. 13. Distribution of TOP-1000 companies by solvency index Globas

Conclusion
Complex assessment of activity of the largest logging companies demonstrates the prevalence of negative trends in their activity in 2011- 2020 (Table 1).

Table 1. Positive and negative trends, evaluation factors
Trends and evaluation factors Relative share of factors, %
Dynamics of the average net assets value down-10
Increase / decrease in the share of enterprises with negative values of net assets up10
Level of monopolization / competition up5
Dynamics of the average revenue down-10
Rate of growth (decline) in the average size of revenue up10
Dynamics of the average profit (loss) down-10
Growth / decline in average values of net profit down-10
Growth / decline in average values of net loss down-10
Increase / decrease in average values of current liquidity ratio down-10
Increase / decrease in average values of return on investment ratio up10
Increase / decrease in average values of asset turnover ratio, times down-10
Share of small and medium-sized businesses in terms of revenue being more than 20% up10
Regional concentration down-5
Financial position (the largest share) up5
Solvency index Globas (the largest share) up10
Average value of relative share of factors down-1,0

вверх positive trend (factor), вниз negative trend (factor)