Information agency Credinform prepared a ranking of profitability of services of the largest Russian recruitment agencies. Companies with the highest volume of revenue (TOP-10) were selected for this ranking according to the data from the Statistical Register for the latest available periods (2016 and 2015). The enterprises were ranked by decrease in profitability of services (Table 1). The analysis was based on data from the Information and Analytical system Globas.
Profitability of services or goods (%) is sales profit to expenses from ordinary activities. Profitability in general indicates production efficiency. The analyses of profitability of services allows to conclude about expediency of one or another kind of services. There is no standard value for profitability indicators, because they change in accordance with the industry the company operates in.
Taking into account the actual situation both in economy in general and in the sector, the experts of the Information agency Credinform have developed and implemented in the Information and Analytical system Globas the calculation of practical values of financial ratios, which can be recognized as normal for a particular industry. The practical value for companies engaged in recruitment in 2016 is from 2,29%.
For the most complete and objective view of the financial condition of the enterprise it is necessary to pay attention to the complex indicators and financial ratios of the company.
Name, INN, region | Revenue, mln RUB | Net profit, mln RUB | Profitability of services, % | Solvency index Globas | |||
2015 | 2016 | 2015 | 2016 | 2015 | 2016 | ||
1 | 2 | 3 | 4 | 5 | 6 | 7 | 8 |
LLC HEADHUNTER INN 7718620740 Moscow |
2 696,2 | 3 357,4 | 1 142,9 | 1 349,3 | 95,45 | 82,45 | 205 Strong |
LLC LUKOIL PERSONAL INN 7707320456 Moscow |
748,3 | 972,1 | 12,2 | 51,3 | 1,22 | 9,36 | 168 Superior |
LLC PROFTEKHNOLOGII INN 4027107319 Moscow |
723,3 | 763,8 | 7,4 | 2,6 | 1,49 | 1,11 | 273 Medium |
LLC MEGATEKS INN 7807307628 Saint-Petersburg |
594,3 | 594,3 | 2,1 | 1,1 | 0,19 | 1,04 | 218 Strong |
LLC SPETSPERSONAL INN 6685049037 Moscow |
749,6 | 713,4 | 9,9 | 1,1 | 1,76 | 1,02 | 292 Medium |
LLC GAZPROM PERSONAL INN 7728794168 Moscow |
1 163,0 | 1 476,7 | 5,5 | -8,3 | -0,80 | 0,72 | 275 Medium |
LLC AUTSTAF STOLITSA INN 7714743371 Moscow |
854,5 | 669,9 | 7,2 | 1,2 | 1,71 | 1,71 | 279 Medium |
LLC Association of Consultants for Personnel Selection INN 7728700875 Moscow |
1,7 | 719,9 | 0,0 | 0,0 | -4,67 | -0,24 | 550 Insufficient |
LLC AVANTA SOLUTIONS INN 7707309438 Moscow |
2 343,8 | 2 415,1 | -129,4 | -62,7 | -4,94 | -1,40 | 285 Medium |
LLC CENTER FOR LABOR INITIATIVES FACTOR OF SUCCESS INN 7743794420 Moscow |
364,2 | 364,2 | 0,1 | 1,2 | -7,95 | -1,73 | 550 Insufficient |
Total for TOP-10 | 10 239,0 | 12 664,7 | 1 057,8 | 1 336,9 | |||
Average value for TOP-10 companies | 1 023,9 | 1 266,5 | 105,8 | 133,7 | 8,35 | 9,29 | |
Average value for industry | 21,3 | 21,7 | 0,8 | 0,7 | 4,92 | 4,43 |
Average value of profitability of services ratio for TOP-10 is above the practical and industry average. However only two companies in TOP-10 have values higher than practical in 2016, five – lower, and three companies have negative value (marked with green, orange and red in columns 6 and 7 of Table 1 and on Picture 1). Three companies in the top of the ranking have increased revenue and net profit figures in 2016 compared to the previous period. The rest of companies decreased revenue or net profit, or have losses (filled with red in columns 3 and 5 of Table 1).
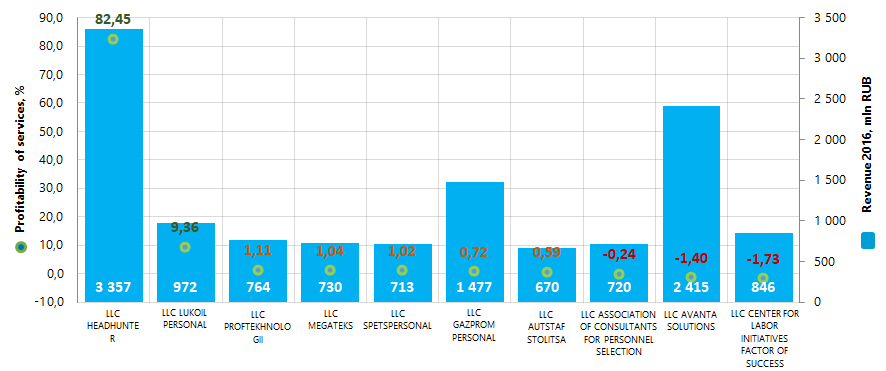
The average industry indicators of profitability of services ratio over the past 7 years were above practical value (Picture 2). This may indicates a relatively positive trend in in this field.
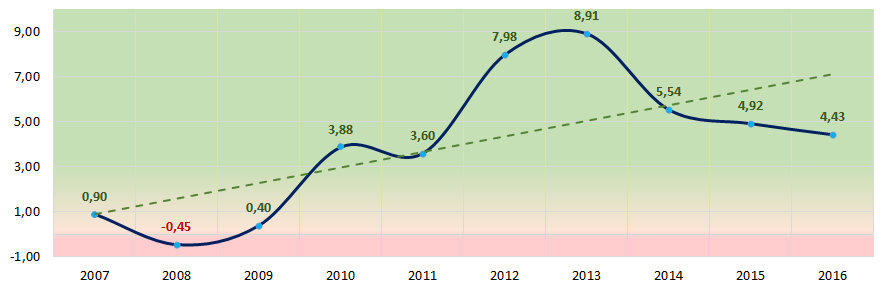
Eight companies in TOP-10 got high, strong, medium and superior indexes Globas, that indicates their ability to timely and fully fulfill debt liabilities.
LLC ASSOCIATION OF CONSULTANTS FOR PERSONNEL SELECTION and CENTER FOR LABOR INITIATIVES FACTOR OF SUCCESS have got insufficient Solvency index Globas, due to negative signs peculiar to fly-by-night and unreliable companies. Index development forecast is negative.
Information Agency Credinform has prepared the review of trends in brewing.
The largest enterprises (TOP-10 and TOP-800) in terms of annual revenue were selected according to the data from the Statistical Register for the latest available periods (2015 and 2016). The analysis was based on data of the Information and Analytical system Globas.
Legal forms and unreliable data
The most popular legal form among companies in the field of brewing is Limited Liability Company. A significant place also take non-public joint stock companies (Picture 1).

According to the results of investigation of the Federal Tax Service of the RF, 2,6% of companies in the industry have records of unreliable data entered into the Unified State Register of Legal Entities (Picture 2).

Sales revenue
In 2016 total revenue of 10 largest companies amounted to 84% from TOP-800 total revenue. This fact testifies high level of monopolization within the industry. In 2016, the largest company by total revenue is LLC Baltika Breweries (Picture 3).

The best results by revenue among the industry for the ten-year period were achieved in 2009. The decrease in average industry indicators was observed within crisis phenomena in the economy in 2010 and 2012-2016. In general, the decrease in sales revenue is observed (Picture 4).

Profit and loss
In 2016 profit of the 10 largest companies amounted to 90% from TOP-800 total profit. In 2016, the leading position by profit also takes LLC Baltika Breweries (Picture 5).

For the ten-year period, the average industry revenue values of companies in the field of beer production are not stable. The negative values were observed in 2014 against the background of crisis phenomena in the economy. In recent years, the growth of indicators is observed, however, in general, the revenue ratios demonstrate decreasing tendency. The best results of the industry were observed in 2009 (Picture 6).

In 2015, the TOP-800 list included 286 loss-making companies. In 2016 the number of loss-making companies increased to 295 or by 3%. Meanwhile, their average loss decreased by 75%. The average profit of other companies from TOP-800 list increased by 25% for the same period (Picture 7).

Main financial indicators
For the ten-year period, the average industry values of current liquidity ratio within five years were lower than recommended values - from 1,0 to 2,0. (yellow color on Picture 8).
Current liquidity ratio (ratio of total working capital to short-term liabilities) shows the sufficiency of company’s assets to meet short-term obligations.
Solvency ratio (ratio of equity capital to total balance) shows the company’s dependence from external borrowings. The recommended value of the ratio is >0,5. The ratio value less than minimum limit signifies about strong dependence from external sources of funds.
The calculation of practical values of financial indicators, which might be considered as normal for a certain industry, has been developed and implemented in the Information and Analytical system Globas by the experts of Information Agency Credinform, taking into account the actual situation of the economy as a whole and the industries. In 2016 the practical value of solvency ratio for the companies in the field of beer production is from -0,12 to 0,41.
For the ten-year period, the average industry values of the ratio within nine years were lower than recommended values and higher than practical values (Picture 8).
In general, the downtrend is observed for both ratios.

For the last ten years, the instability of ROI ratio was observed. In the period of crisis phenomena in the economy in 2014 the ratio decreased to negative values (Picture 9). The ROI ratio is calculated as a ratio of net profit to sum of stockholder equity and long-term liabilities and shows the return from equity involved in commercial activities and long-term borrowed funds.
Within the same period, the products profitability ratio was also unstable (Picture 9). Product profitability ratio is a ratio of sales profit to general expenses. In general, the profitability characterizes the production efficiency.
The greatest growth of indicators was observed in 2009. In general, the ratios demonstrate the negative trend.

Assets turnover ratio is the ratio of sales revenue and company’s average total assets for a period. It characterizes the effectiveness of using of all available resources, regardless the source of their attraction. The ratio shows how many times per year the full cycle of production and circulation is performed, generating the corresponding effect in the form of profit.
Equity turnover ratio is calculated as a ratio of revenue to yearly average sum of equity and demonstrates the company’s usage rate of total assets.
For the ten-year period, both ratios demonstrated relative stability with slight downtrend (Picture 10).

Dynamics of business activity
Over a 25-year period, the registered companies from TOP-800 list are unequally distributed by the year of foundation. Most of the companies engaged in beer production were founded in 2014. In general, the increasing tendency is observed (Picture 11).

The most outstanding interest of business to beer production is observed after 2010 (Picture 12).

Main regions of activity
Companies in the field of beer production rather equally distributed across the country. Most of them are registered in Krasnodar region – the region with developed infrastructure of agriculture and food industry (Picture 13).
TOP-800 companies are registered in 78 regions of the Russian Federation.

Most of the companies of the industry are concentrated in the Central Federal District (Picture 14).

The share of companies from TOP-800 list with branches or representative offices amounted to 2,4%.
Participation in arbitration proceedings
Most companies of the sector either do not participate in arbitration proceedings, or participate in a small number of cases (Picture 15).

Reliability index
The risk of meeting a fly-by-night company or an unreliable company is extremely low for the most companies of the sector (Picture 16).

Financial position score
The assessment of company’s financial position shows that more than one third of companies are in unstable and critical financial position and the same number of companies have average financial position (Picture 17).

Liquidity index
Almost more than a half of industry companies have the highest or above average level of bankruptcy risk in the short-term period (Picture 18).

Solvency index Globas
More than a half of TOP-800 companies have adequate and weak solvency index Globas. Thus, almost more than one third of companies have superior, high or strong, medium solvency index Globas (Picture 19).

Hereby, the complex assessment of beer production companies, taking into account main indexes, financial ratios and indicators, shows negative trends in this field of activity. However, in the last two years, the industry situation started to stabilize.