
Order a report
Custom-made industry research, company ratings, competitor analysis


Trends in activity of the largest companies of the Moscow region real economy
Information Agency Credinform presents a review of trends in activity of the largest companies of the Moscow region real economy.
The enterprises with the highest volume of annual revenue (TOP-10 and TOP-1000) within the non-financial sector of the Moscow region have been selected for the ranking, according to the data from the Statistical Register for the latest available accounting periods (2014-2016). the analysis was based on the data from the Information and Analytical system Globas.
Net assets
It is an indicator of fair value of corporate assets that is calculated annually as assets on balance less company’s liabilities. Net assets value is negative (insufficiency of property) if liabilities are larger than the assets.
| No. in TOP-1000 | Name | Net asset value, billion RUB* | Solvency index Globas | ||
| 2014 | 2015 | 2016 | |||
| 1. | GAZPROM INTERREGIONGAS LLC Wholesale of solid, liquid and gaseous fuel |
407,3 | 449,6 | 575,7 | 215 Strong |
| 2. | T PLUS PJSC Production of electric power |
122,8 | 125,5 | 145,6 | 205 Strong |
| 3. | MARS LLC Production of chocolate and sugar confectionery |
66,3 | 81,0 | 82,7 | 183 Superior |
| 4. | AUCHAN LLC Retail sale of mostly food products |
43,6 | 51,2 | 59,5 | 237 Strong |
| 5. | MACHINE-BUILDING PLANT PJSC Nuclear fuel production |
32,9 | 40,0 | 44,9 | 147 Superior |
| 996. | MULTIFLEX NJSC Production of plastic packaging |
-1,3 | -2,8 | -5,1 | 320 Adequate |
| 997. | EURASIA M4 JOINT VENTURE NJSC Leasing and management of own or rented non-residential real estate |
-5,4 | -9,2 | -9,0 | 256 Medium |
| 998. | KASHIRSKI MALL NJSC Leasing and management of own or rented non-residential real estate |
-7,6 | -14,0 | -10,1 | 267 Medium |
| 999. | CROCUS INTERNATIONAL NJSC Leasing and management of own or rented non-residential real estate |
-13,5 | -26,3 | -11,8 | 213 Strong |
| 1000. | FORD SOLLERS HOLDING LLC Production of motor vehicles |
5,5 | 4,0 | -19,2 | 334 Adequate |
*) – growth or decline values compared to prior period are highlighted green and red respectively in columns 4 and 5.
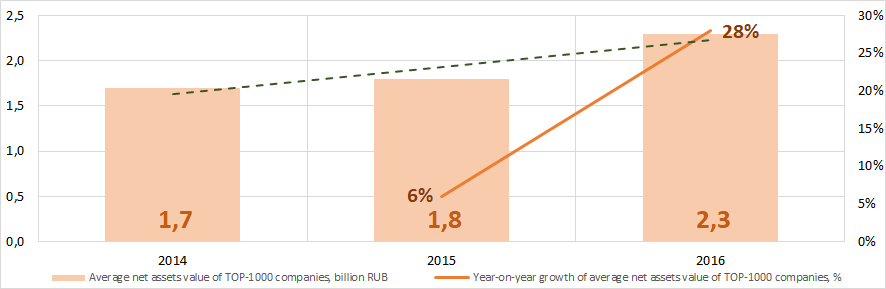 Picture 1. Change in average net asset value of the largest real economy companies of Moscow region in 2014 – 2016
Sales revenue
In 2016 sales revenue of 10 industry leaders within the real economy of Moscow region amounted to 35% of total revenue of TOP-1000 companies (Picture 2).
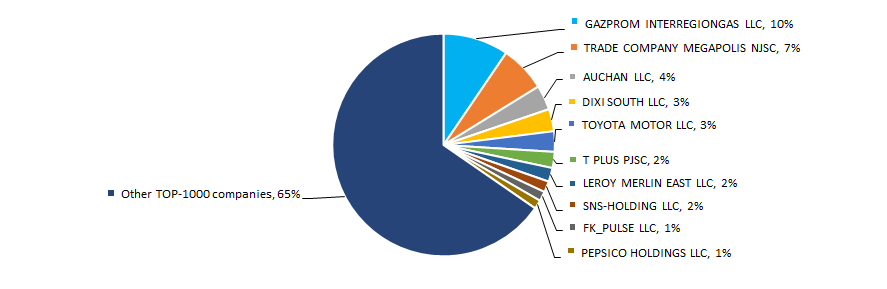 Picture 2. TOP-10 by their share in 2016 total revenue of TOP-1000 companies
Revenue volume tends to increase (Picture 3).
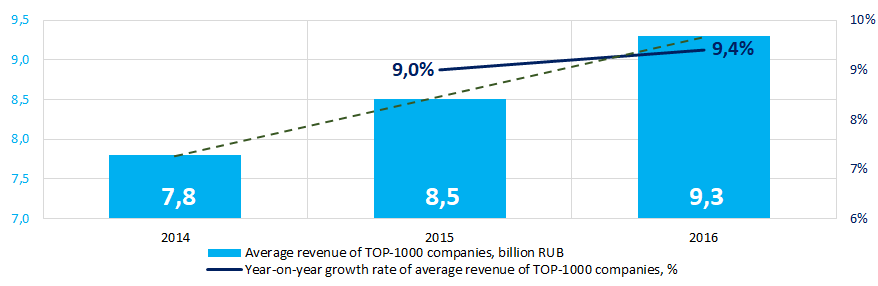 Picture 3. Change in average revenue of real economy companies of Moscow region in 2014– 2016
Profit and loss
In 2016 profit of 10 industry leaders of real economy in Moscow region amounted to 37% of total profit of TOP-1000 companies (Picture 4).
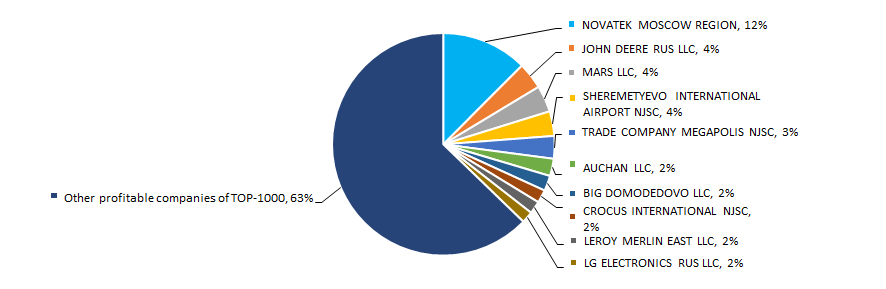 Picture 4. TOP-10 companies by their share in 2016 total profit of TOP-1000 companies
Average profit values of TOP-1000 companies for three years tend to increase, and average loss value is decreasing (Picture 5).
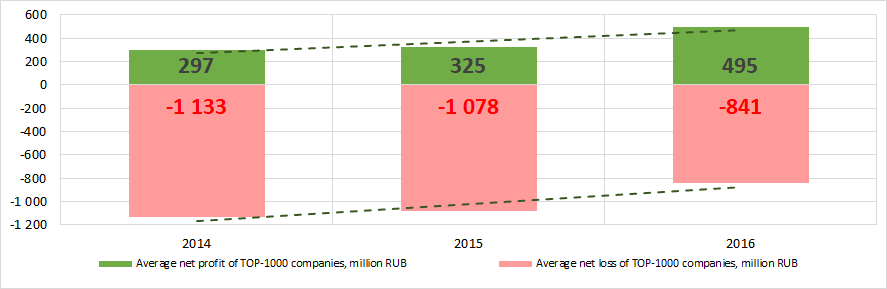 Picture 5. Change in average profit and loss of the largest real economy companies of Moscow region in 2014 – 2016
Key financial ratios
During 2014 – 2016 average values of liquidity coverage ratio of TOP-1000 companies were higher or within the recommended value – from 1,0 to 2,0 (Picture 6).
Liquidity coverage ratio (a ratio of current assets to current liabilities) reveals the sufficiency of a company’s funds for meeting its short-term liabilities.
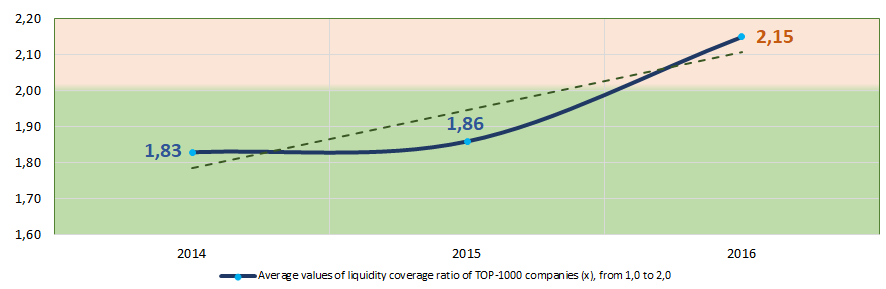 Picture 6. Change in average values of liquidity coverage ratio of real economy companies of Moscow region in 2014 – 2016
The return on investment ratio was not stable during these three years, tending to decrease (Picture 7). It is a ratio of net profit to shareholders’ equity and noncurrent liabilities, and it demonstrates benefit from shareholders’ equity engaged in business activity and long-term raised funds of the company.
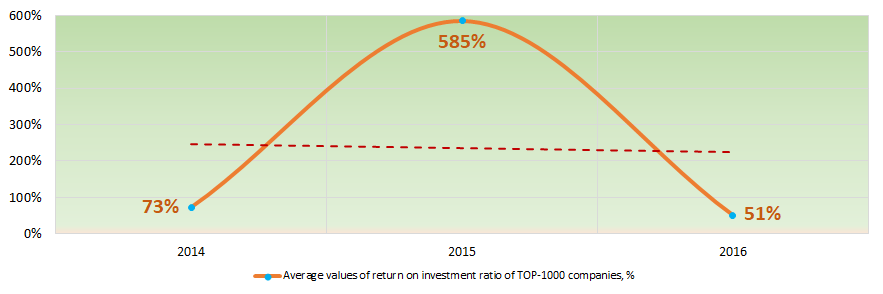 Picture 7. Change in average values of return on investment ratio of real economy companies of Moscow region in 2014 – 2016
Assets turnover ratio is a ratio of sales revenue to average total assets for the period, and measures resource efficiency regardless of the sources. the ratio indicates the number of profit-bearing complete production and distribution cycles per annum.
During three years, this activity ratio tended to increase in general (Picture 8).
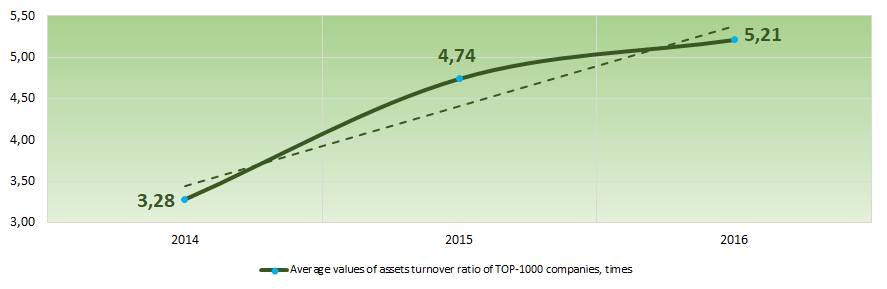 Picture 8. Change in average values of assets turnover ratio of the largest real economy companies of Moscow region in 2014 – 2016
Structure of production and services
Wholesale and retail trade companies have the largest share in total revenue of TOP-1000 companies (Picture 9).
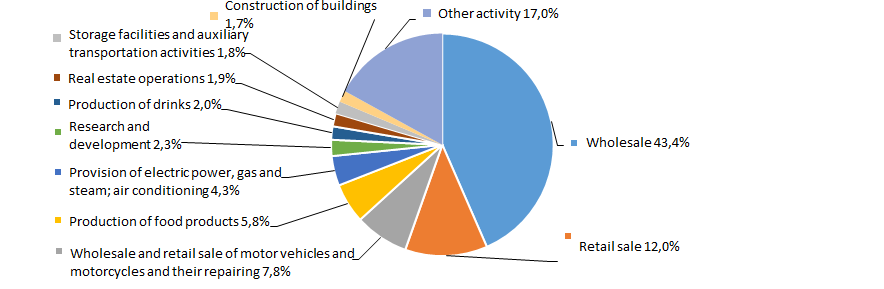 Picture 9. Types of activity by their share in total revenue of TOP-1000, %
Financial position score
Assessment of financial state of TOP-1000 companies indicates that over a half of the companies have an above average financial standing (Picture 10).
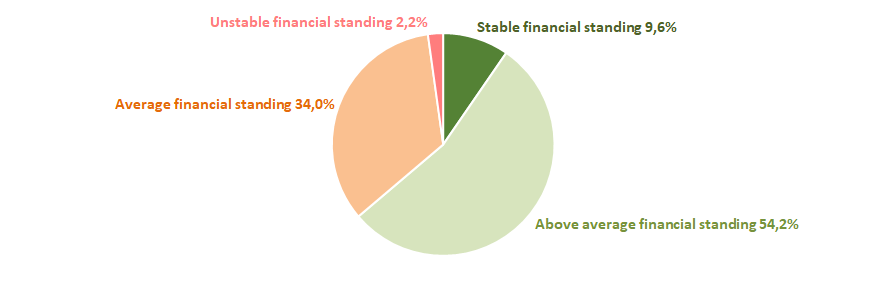 Picture 10. TOP-1000 companies by their financial position score
Solvency index Globas
The most of TOP-1000 companies have got a superior, high, strong and medium Solvency index Globas, that indicates their capability to meet liabilities timely and in full (Picture 11).
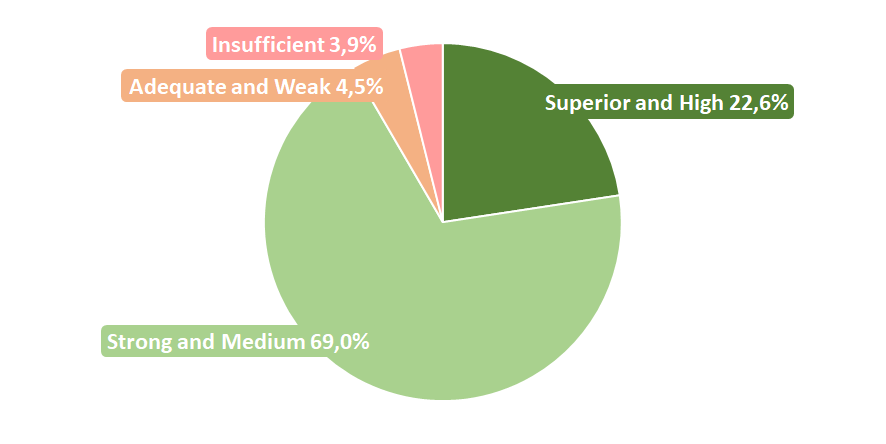 Picture 11. TOP-1000 companies by Solvency index Globas
Therefore, a comprehensive assessment of the largest real economy companies of Moscow region that considers key indexes, financial figures and ratios, is indicative of positive trends in the sector.