
Order a report
Custom-made industry research, company ratings, competitor analysis


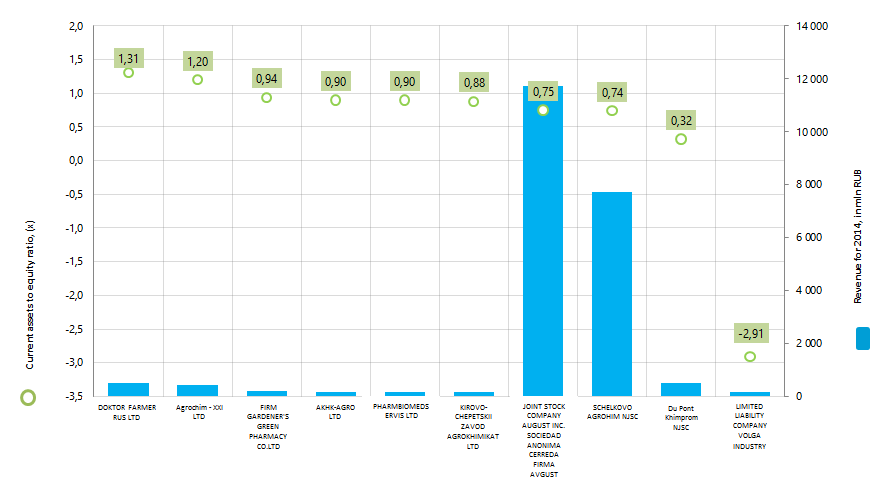
The largest Russian manufacturers of agrochemical products on the current assets to equity ratio
Information agency Credinform offers the ranking of the largest Russian manufacturers of agrochemical products on the current assets to equity ratio.
The manufacturers of agrochemical products with the highest volume of revenue (TOP-10) were selected for the ranking, according to the data from the Statistical Register for the latest available accounting period (for the year 2014). Then the companies were ranked by decrease in the current assets to equity ratio (Table 1).
Current assets to equity ratio (х) characterizes the company's ability to maintain the level of its own working capital and replenish current assets in case of need at its own sources. This indicator is calculated as a ratio of company’s own current assets to the total sum of own assets. The recommended value ranges from 0,2 to 0,5.
Decrease of the indicator designates the possible delay in payment of receivables or tightening of trade credit conditions on the part of suppliers or contractors. The increase provides evidence of the growing ability to repay current liabilities.
For getting of the most comprehensive and fair picture of the financial standing of an enterprise it is necessary to pay attention to all available combination of ratios, financial and other indicators.
| Name | Net profit for 2014, in mln RUB | Revenue for 2014, in mln RUB | Revenue for 2014, by 2013, % | Current assets to equity ratio, (х) | Solvency index Globas-i |
|---|---|---|---|---|---|
| DOKTOR FARMER RUS LTD INN 5452115655 Novosibirsk region |
-7,0 | 507,0 | 70 | 1,31 | 600 Unsatisfactory |
| Agrochim - XXI LTD INN 7726547364 Moscow |
-206,7 | 446,7 | 93 | 1,20 | 294 High |
| FIRM GARDENER'S GREEN PHARMACY CO.LTD INN 7727110954 Moscow |
25,9 | 199,9 | 104 | 0,94 | 192 The highest |
| AKHK-AGRO LTD INN 278092847 Republic of Bashkortostan |
5,0 | 156,1 | 101 | 0,90 | 235 High |
| PHARMBIOMEDSERVIS LTD INN 7736188900 Moscow |
1,6 | 153,0 | 106 | 0,90 | 203 High |
| KIROVO-CHEPETSKII ZAVOD AGROKHIMIKAT LTD INN 4312128282 Kirov region |
4,7 | 166,0 | 74 | 0,88 | 259 High |
| JOINT STOCK COMPANY AUGUST INC. SOCIEDAD ANONIMA CERREDA FIRMA AVGUST INN 5046001101 Moscow region |
1 194,5 | 11 742,9 | 113 | 0,75 | 167 The highest |
| SCHELKOVO AGROHIM NJSC INN 5050029646 Moscow region |
1 243,7 | 7 726,7 | 143 | 0,74 | 200 High |
| Du Pont Khimprom NJSC INN 2124013912 Чувашская Chuvash Republic |
12,9 | 495,8 | 100 | 0,32 | 224 High |
| LIMITED LIABILITY COMPANY VOLGA INDUSTRY INN 3448050271 Volgograd region |
0,6 | 158,3 | 82 | -2,91 | 271 High |
DOKTOR FARMER RUS LTD took the first line of the ranking with the value of the current assets to equity ratio equal to 1,31, which indicates a high efficiency of resources use. However, this company got unsatisfactory solvency index Globas-i, due to the fact that it is in the process of reorganization in the form of merger with another legal entity. In addition, this enterprise is one of four in the TOP-10, which admitted a loss or reduction of net profit and revenue in 2014 compared to the previous period.
JOINT STOCK COMPANY AUGUST INC. SOCIEDAD ANONIMA CERREDA FIRMA AVGUST, leading in the industry in terms of revenue, took the seventh line of the ranking. The share of this company in the total volume of revenue of the TOP-10 companies made 54%.
From the presented companies in the TOP-10 Du Pont Khimprom NJSC is the only one enterprise, which showed the normative value of the current assets to equity ratio.
LIMITED LIABILITY COMPANY VOLGA INDUSTRY showed a negative value of the coefficient. A large part of own working capital of this company is capitalized, that can lead to the slowdown in payment of receivables.
On the combination of financial and non-financial indicators nine companies got the highest or high solvency index Globas-i, that indicates their ability to repay its debt obligations timely and fully.
The total revenue of the TOP-10 enterprises made 21,7 billion rubles in 2014, that is by 20% more than in 2013. At the same time the total net income by 35% for the same period.
In the TOP-10 group of companies the average value of the current assets to equity ratio was 0,5 in 2014. It is within the standard value and indicates the ability of the industry leaders to provide the flexibility in the use of own funds. The industry average value of the ratio made 0,72.
In general, the industry shows a positive dynamics of production, as evidenced by the data of the Federal State Statistics Service (Rosstat) (Table 2).
| 2010 | 2011 | 2012 | 2013 | 2014 | 2015 | 2016, 6 months | 2015 by 2010 (+/- %) | |
|---|---|---|---|---|---|---|---|---|
| Mineral or chemical fertilizers | 35 624,60 | 39 407,40 | 37 873,80 | 39 801,70 | 41 476,60 | 42 647,10 | 21 933,20 | 20 |
| Nitrogen, mineral or chemical fertilizers | 14 394,70 | 16 788,60 | 16 998,00 | 18 084,40 | 17 757,50 | 18 861,70 | 10 185,70 | 31 |
| Anhydrous ammonia | 13 294,90 | 13 918,50 | 13 770,70 | 14 441,10 | 14 634,20 | 15 160,90 | 8 023,90 | 14 |
| Potash, chemical or mineral fertilizers | 10 384,60 | 11 090,70 | 9 346,40 | 10 175,10 | 12 280,30 | 11 584,80 | 5 185,70 | 12 |
| Fertilizers nec. | 10 318,40 | 10 985,30 | 11 214,60 | 11 311,70 | 11 244,90 | 12 010,50 | 6 470,60 | 16 |
| Potassium chloride | 10 241,60 | 10 913,70 | 9 215,80 | 10 059,30 | 12 195,30 | 11 500,40 | 5 148,80 | 12 |
| Ammonium nitrate (ammonium saltpeter), including in aqueous solution | 7 021,60 | 8 244,60 | 8 033,20 | 8 406,20 | 8 214,10 | 8 822,10 | 4 505,50 | 26 |
| Other ammonium nitrate (ammonium saltpeter) | 6 405,00 | 7 320,20 | 7 487,40 | 7 755,10 | 7 500,50 | 8 112,90 | 4 193,10 | 27 |
| Chemical or mineral fertilizers, containing three nutrients - nitrogen, phosphorus and potassium (NPK compound fertilizers) | 5 051,00 | 5 382,20 | 5 598,20 | 5 891,50 | 5 658,20 | 6 190,20 | 3 114,40 | 23 |
| Chemical or mineral fertilizers, containing two nutrients – nitrogen and phosphorus (NP compound fertilizers), nec. | 4 687,60 | 4 845,10 | 4 468,50 | 4 184,50 | 4 448,50 | 4 643,70 | 2 666,40 | -1 |
| Ammophos | 2 129,20 | 2 884,30 | 2 411,40 | 2 680,00 | 2 776,00 | 2 690,30 | 1 378,50 | 26 |
| Mineral or chemical fertilizers, including mixtures of fertilizers, other | 532,20 | 706,10 | 1 041,30 | 1 068,00 | 995,70 | 976,30 | 565,20 | 83 |
| Phosphate, mineral or chemical fertilizers | 526,90 | 542,80 | 315,00 | 230,50 | 193,90 | 190,10 | 91,20 | -64 |
| Phosphinates (hypophosphites), phosphonates (phosphites), phosphates and polyphosphates; nitrates, except potassium, sodium, ammonium nitrates | 136,56 | 110,79 | 118,47 | 139,07 | 161,94 | 174,43 | 66,35 | 28 |
| Phosphides, carbides, hydrides, nitrides, azides, silicides and borides | 134,74 | 134,16 | 131,43 | 127,78 | 121,19 | 78,96 | 37,57 | -42 |
| Ammonium chloride; nitrites; potassium nitrates; ammonium carbonates | 21,71 | 23,62 | 21,40 | 49,53 | 55,52 | 58,57 | 30,29 | 176 |
| Calcium nitrate (lime saltpeter) | 6,75 | 4,77 | 6,87 | 12,15 | 30,09 | 50,30 | 20,16 | 645 |
| Anti-sprouting products and plant growth regulators | 0,12 | 0,02 | 0,03 | 0,09 | 1,04 | 0,87 | 0,79 | 625 |
*) – in the table the production growth from year to year (for 2016 – to the corresponding period of 2015) is highlighted in green, the decrease in production – in red.
Companies, producing agrochemical products, are distributed across country's regions unequal and biased to the most developed financial and industrial centers.
Thus, according to the Information and analytical system Globas-i, 100 the largest companies on the volume of revenue for 2014 are registered in 33 regions. The greatest number of them is registered in the following regions (TOP-8 Regions):
| Region | Number of companies |
|---|---|
| Moscow | 25 |
| Moscow region | 17 |
| Novosibirsk region | 7 |
| Republic of Bashkortostan | 7 |
| Krasnodar territory | 4 |
| Rostov region | 4 |
| Kirov region | 3 |
| Tyumen region | 3 |