
Order a report
Custom-made industry research, company ratings, competitor analysis


TOP 1000 companies with foreign shareholders
Federal Law No. 384-FZ dated 29.11.2021 introduced new restrictions on provision of investment and subsidies from the state budget to companies with foreign shareholders. This may help to reduce foreign investment and increase domestic investment in the basic materials sector of the country's economy where a significant number of enterprises with foreign shareholding is concentrated. Activity trends of these companies are observed to be negative during the past 5 years.
The most significant of them are decrease in average net assets values, revenue and profit growth rates, increase in net losses, and slowdown of return on investment and business activity indicators, significant regional disproportions.
Among positive trends are net assets, revenue and profit increase, and positive indicators of financial stability.
In order to analyze activities of this legal entities’ category, Information agency Credinform using the Globas selected the largest companies in terms of annual revenue for the last reporting periods available to the state statistics bodies and the Federal Tax Service (2015-2020). The largest companies in terms of annual revenue where one of the shareholders from among legal entities has up to 25% equity holding were selected for the TOP 1000.
Net assets is a ratio that reflects the real value of the company's property that is calculated annually as the difference between the assets on the company's balance sheet and its debt obligations. The net asset ratio is negative (insufficient property) if the company's debt exceeds the value of its property.
The largest company in the TOP 1000 in terms of net assets is ROSNEFT OIL COMPANY PJSC, INN 7706107510, Moscow, oil extraction. In 2020, net assets amounted to over 2.2 trillion RUB.
YAMAL SPG PJSC had the smallest net assets in the TOP 1000, INN 7709602713, Yamalo-Nenets Autonomous region, liquefaction and enrichment of natural gas at the production site for subsequent transportation. Property insufficiency in 2020 was expressed by a negative value of -366 billion RUB.
During the five-year period, average net assets of the TOP 1000 increased with a decrease in their growth rates (Picture 1).
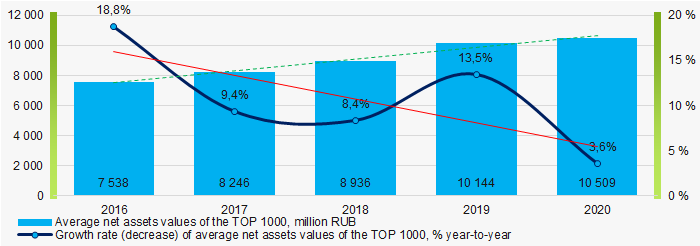 Picture 1. Change in average net assets of the TOP 1000 in 2016-2020
Shares of companies with property insufficiency in the TOP 1000 had a positive downward trend over the past five years (Picture 2).
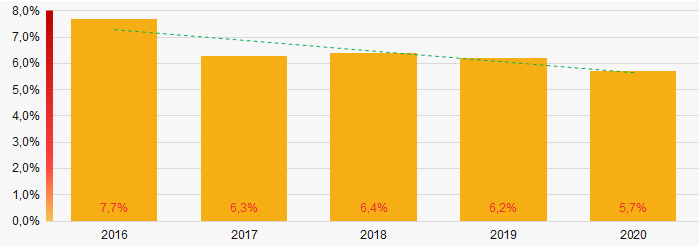 Picture 2. Shares of the TOP 1000 companies with negative net assets in 2016-2020
Revenue
The largest company in the TOP 1000 in terms of revenue in 2020 is also ROSNEFT OIL COMPANY PJSC . Revenue amounted to over 4.8 trillion RUB.
During the five-year period, average revenue values of the TOP 100 have been increasing with a decrease in their growth rate year by year. (Picture 3).
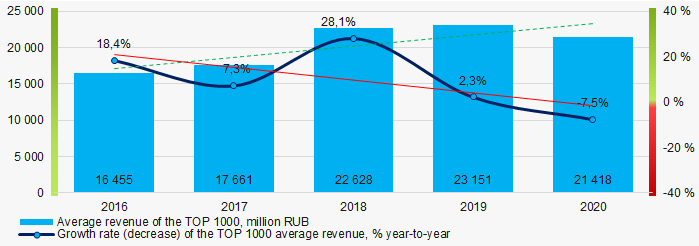 Picture 3. Changes in the average revenue values of the TOP 1000 in 2016-2020.
Profit and loss
The largest company in the TOP 1000 in terms of net profit in 2020 is NOVATEK PJSC, INN 6316031581, Yamalo-Nenets Autonomous region, wholesale of solid, liquid and gaseous fuels and similar products. The profit amounted to over 376 billion RUB.
During the five-year period, indicators of average profit of the TOP 1000 increase with a decrease in their growth rate from year to year. (Picture 4).
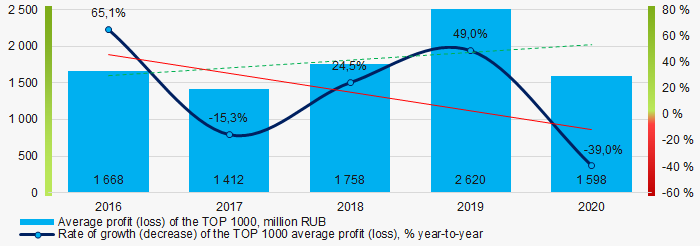 Picture 4. Change in average profit (loss) ratios of the TOP 1000 in 2016-2020.
During the five-year period, average values of net profit and net loss indicators of the TOP 1000 have both increasing and decreasing trends. (Picture 5).
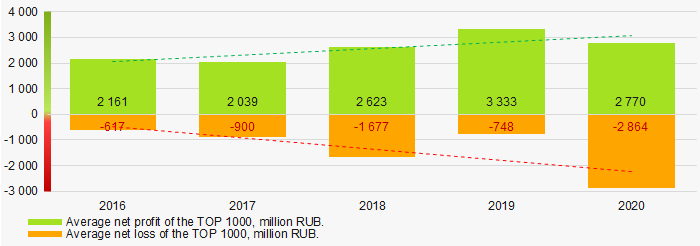 Picture 5. Changes in average values of net profit and net loss ratios of the TOP 1000 companies in 2016-2020
Key financial ratios
During the five-year period, average indicators of the total liquidity ratio of the TOP 1000 were above the range of recommended values - from 1.0 to 2.0, with a tendency to increase. (Picture 6).
Current liquidity ratio (current assets to short-term liabilities) shows the sufficiency of company’s assets to repay on short-term liabilities.
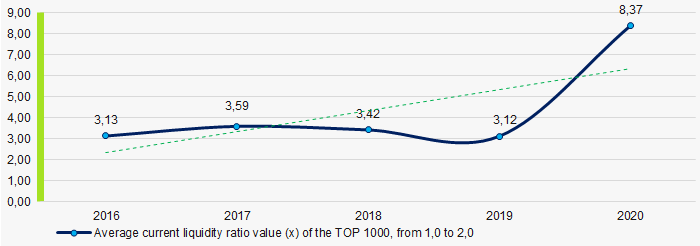 Picture 6. Changes in the total liquidity ratio average industry values of the TOP 1000 in 2016-2020.
During the five-year period, the average return on investment ratio of the TOP 1000 has shown a downward trend. (Picture 7).
This ratio is calculated as a ratio of net profit to amount of equity and long-term liabilities and demonstrates return on equity involved in commercial activities and long-term funds raised by organization.
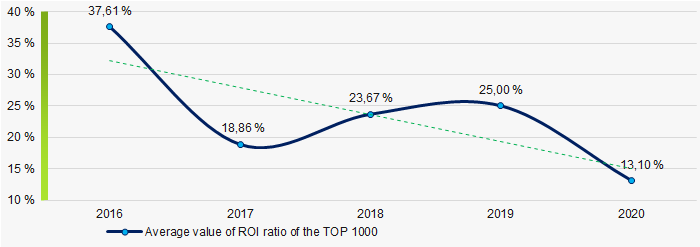 Picture 7. Change in investments profitability ratio average values of the TOP 1000 in 2016-2020.
The asset turnover ratio is calculated as ratio of sales revenue to average value of total assets for a period and implicates the efficiency of use of all available resources; regardless of the sources, they were raised. The ratio shows how many times per year the full cycle of production and turnover is performed generating the corresponding effect in the form of profit.
During the five-year period, average indicators of this business activity ratio of the TOP 1000 tended to decrease (Picture 8).
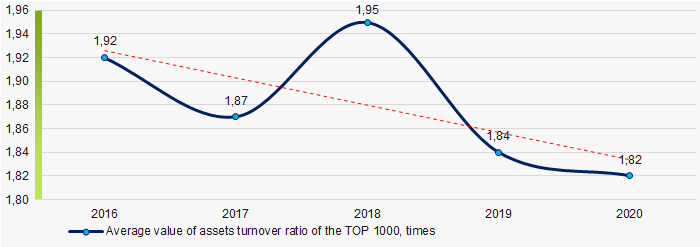 Picture 8. Change in asset turnover ratio average values of the TOP-1000 in 2016-2020.
Small enterprises
Only 6% of the TOP 1000 companies are registered in the Unified Register of Small and Medium-sized Enterprises of the Federal Tax Service of the Russian Federation. At the same time, the share of their revenue in the total volume of the TOP 100 in 2020 was only 0.33%, which is significantly lower than the national average in 2018 - 2019. (Picture 9).
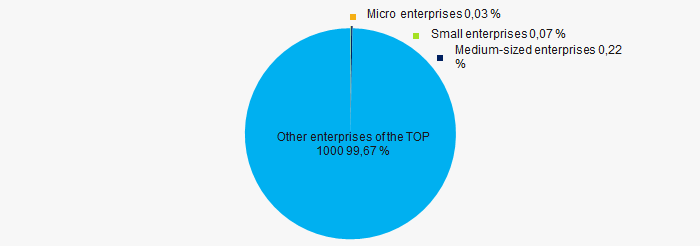 Picture 9. Revenue shares of small and medium-sized enterprises in the TOP-1000
Main regions of activity
TOP-1000 companies are registered in 63 regions (74% of the subjects of the Russian Federation) and are distributed rather unevenly across the country. Over 52% of the total revenue of the TOP 1000 companies in 2020 is concentrated in Moscow (Picture 10).
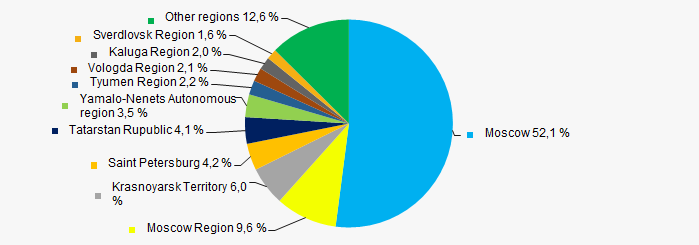 Picture 10. Distribution of the TOP 1000 companies' revenue by Russian regions
Financial position score
Financial position assessment of the TOP 1000 companies shows that the largest part of them has above average financial position. (Picture 11).
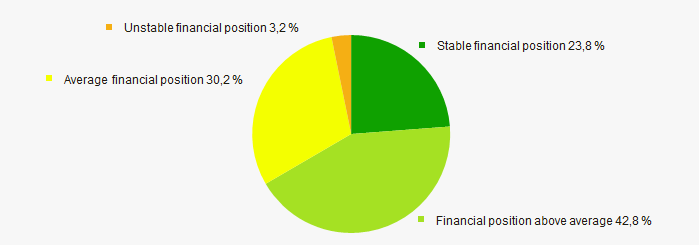 Picture 11. Distribution of the TOP 1000 companies by financial position score
Globas Solvency Index
The largest part of the TOP 1000 companies has been assigned Superior and High Globas Solvency Index. This indicates their ability to fully meet their debt obligations (Picture 12).
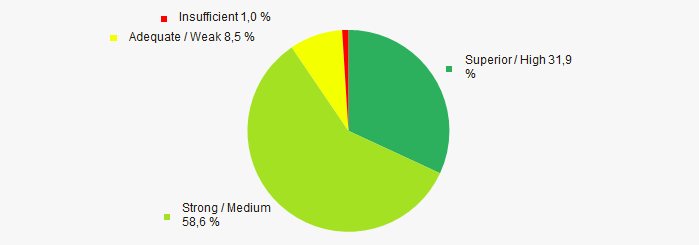 Picture 12. Distribution of the TOP 1000 companies according to the Globas Solvency Index
Conclusion
Comprehensive assessment of the largest companies’ activities with foreign shareholding indicates the predominance of negative trends in their activities in the period from 2016 to 2020. (Table 1).
| Trends and evaluation factors | Share of factor, % |
| Dynamics of average net assets value | |
| Rate of growth (decline) in the average size of net assets | |
| Enterprises' share increase / decrease with net assets negative values | |
| Dynamics of the average revenue | |
| Growth (decline) rate in average value of revenue | |
| Dynamics of average profit (loss) | |
| Growth (decline) rate in the average size of profit (loss) | |
| Growth / decline in average values of companies’ net profit | |
| Growth / decline in average values of net loss | |
| Growth / decrease in average values of overall liquidity ratio | |
| Growth / decrease in average values of return on investment ratio | |
| Growth / decrease in average values of asset turnover ratio, times | |
| Share of small and medium-sized enterprises in revenue is more than 20% | |
| Regional concentration | |
| Financial position (the largest share) | |
| Globas Solvency Index (the largest share) | |
| Average value of factors share | |
![]() positive trend (factor),
positive trend (factor), ![]() negative trend (factor)
negative trend (factor)